Copyright
©2010 Baishideng Publishing Group Co.
World J Gastroenterol. Oct 14, 2010; 16(38): 4809-4816
Published online Oct 14, 2010. doi: 10.3748/wjg.v16.i38.4809
Published online Oct 14, 2010. doi: 10.3748/wjg.v16.i38.4809
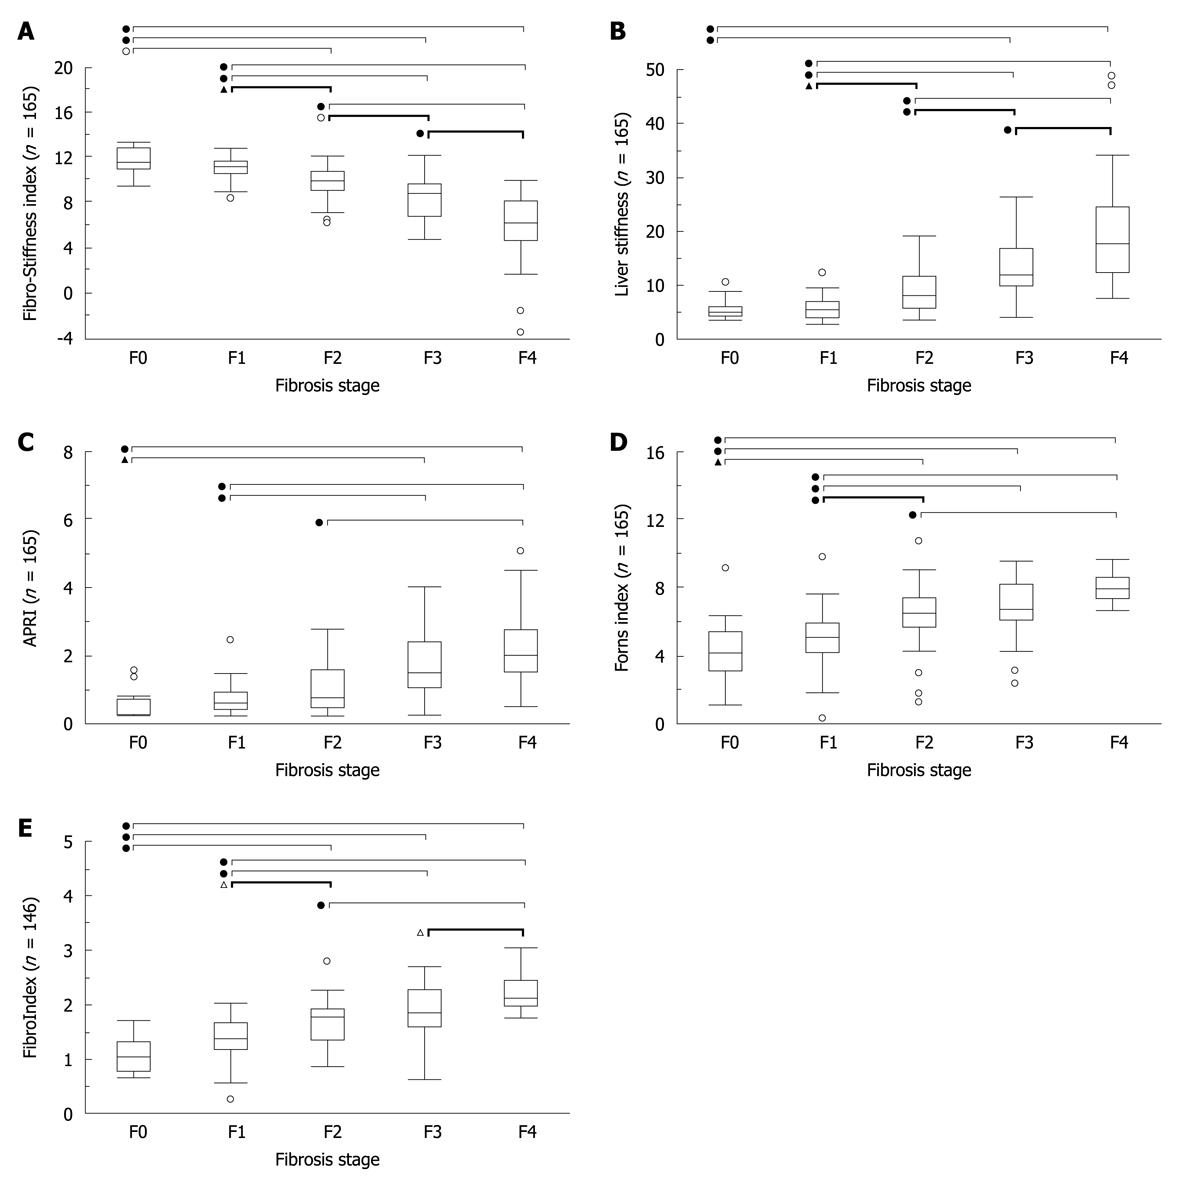
Figure 1 Correlation between 5 noninvasive methods for assessment of fibrosis and stage of fibrosis in the estimation group.
A: Fibro-Stiffness index: ρ = -0.7626, P < 0.0001; B: Liver stiffness measured by FibroScan: ρ = -0.7340, P < 0.0001; C: Aspartate aminotransferase-to-platelet ratio index (APRI): ρ = 0.6008, P < 0.0001; D: Forns index: ρ = 0.6175, P < 0.0001; E: FibroIndex: ρ = 0.6496, P < 0.0001. The top and bottom of each box represent the 25th and 75th percentiles, giving the interquartile range. The line through the box indicates the median, and the error bars indicate the 10th and 90th percentiles. The closed circles, the closed triangles, the open circles and the open triangles indicate P-values of 0.001, 0.005, 0.01 and 0.05, respectively.
- Citation: Ichino N, Osakabe K, Nishikawa T, Sugiyama H, Kato M, Kitahara S, Hashimoto S, Kawabe N, Harata M, Nitta Y, Murao M, Nakano T, Arima Y, Shimazaki H, Suzuki K, Yoshioka K. A new index for non-invasive assessment of liver fibrosis. World J Gastroenterol 2010; 16(38): 4809-4816
- URL: https://www.wjgnet.com/1007-9327/full/v16/i38/4809.htm
- DOI: https://dx.doi.org/10.3748/wjg.v16.i38.4809


