Copyright
©2010 Baishideng.
World J Gastroenterol. Aug 21, 2010; 16(31): 3936-3943
Published online Aug 21, 2010. doi: 10.3748/wjg.v16.i31.3936
Published online Aug 21, 2010. doi: 10.3748/wjg.v16.i31.3936
Figure 1 Electrophoretic analysis of the cagA 3’ variable region by polymerase chain reaction.
The polymerase chain reaction amplicons were analyzed on a 1% agarose gels. From left to right, lane 1 shows a 100 base pair DNA ladder, lane 2 negative control, lane 3 reference strain Helicobacter pylori NCTC 11637, lanes 4-14 show products of isolates from different patients.
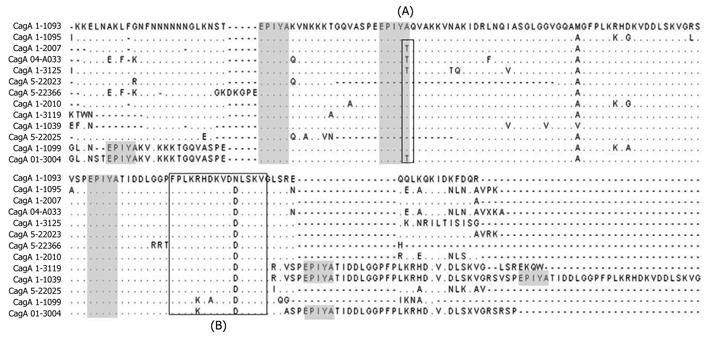
Figure 2 Multiple alignment of the amino acid sequence of the 3’ region from cagA.
First Square (A) shows the Glutamine acid-Proline-Isoleucine-Tyrosine-Alanine (EPIYA) motifs which had a modified EPIYA-B motif (EPIYT) instead of EPIYA. Second Square (B) shows the CagA multimerization (CM) motif which contains the amino acid sequence FPLXRXXXVXDLSKVG. The shaded squares represent the localization of EPIYA motif in the alignment. Amino acids are designated by standard one-letter codes. (∙) same residue; (-) gap. GenBank accession numbers and EPIYA motif of each isolate in this figure: CagA 1-1093 (FJ915841) (ABC), CagA 1-1095 (FJ915842) (ABC), CagA 1-2007 (FJ915843) (ABC), CagA 04-A033 (FJ915904) (ABC), CagA 1-3125 (FJ915893) (ABC), CagA 5-22023 (FJ915937) (AC), CagA 5-22366 (FJ915913) (ABC), CagA 1-2010 (FJ915844) (ABC), CagA 1-3119 (FJ915891) (ABCC), CagA 1-1039 (FJ915944) (ABCCC), CagA 5-22025 (FJ915878) (BC), CagA 1-1099 (FJ915912) (AABC) and CagA 01-3004 (FJ915917) (AABCC).
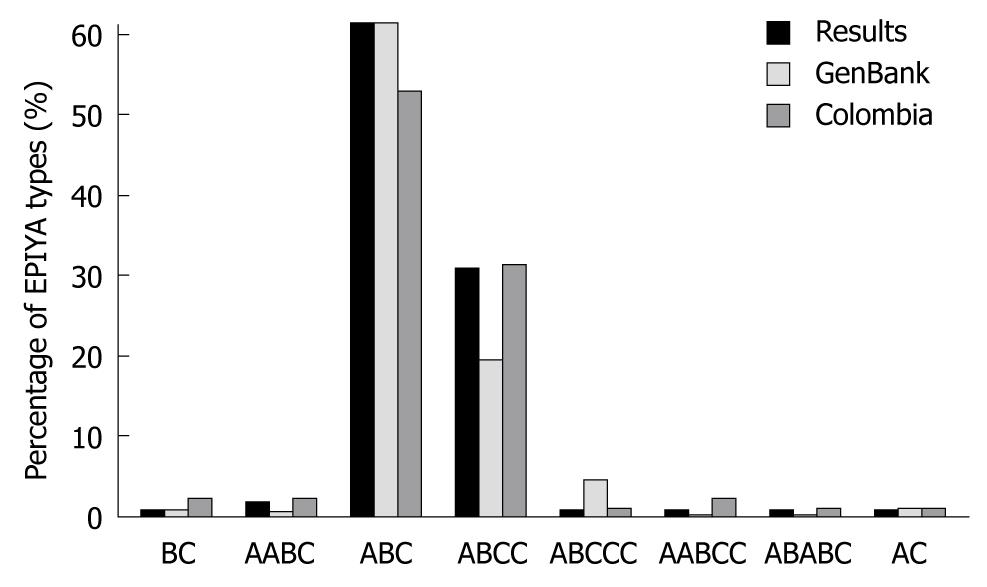
Figure 3 Comparison between the prevalence of different types of CagA tyrosine phosphorylation motifs from this study compared with data obtained from Argent et al[39] and Colombian strains reports in gene bank.
There is a statistical difference between the frequency of ABCC pattern in Western strains reported in GenBank (19.6%) and our results (31.1%). EPIYA: Glutamine acid-Proline-Isoleucine-Tyrosine-Alanine.
-
Citation: Acosta N, Quiroga A, Delgado P, Bravo MM, Jaramillo C.
Helicobacter pylori CagA protein polymorphisms and their lack of association with pathogenesis. World J Gastroenterol 2010; 16(31): 3936-3943 - URL: https://www.wjgnet.com/1007-9327/full/v16/i31/3936.htm
- DOI: https://dx.doi.org/10.3748/wjg.v16.i31.3936


