Copyright
©2010 Baishideng.
World J Gastroenterol. Aug 21, 2010; 16(31): 3911-3918
Published online Aug 21, 2010. doi: 10.3748/wjg.v16.i31.3911
Published online Aug 21, 2010. doi: 10.3748/wjg.v16.i31.3911
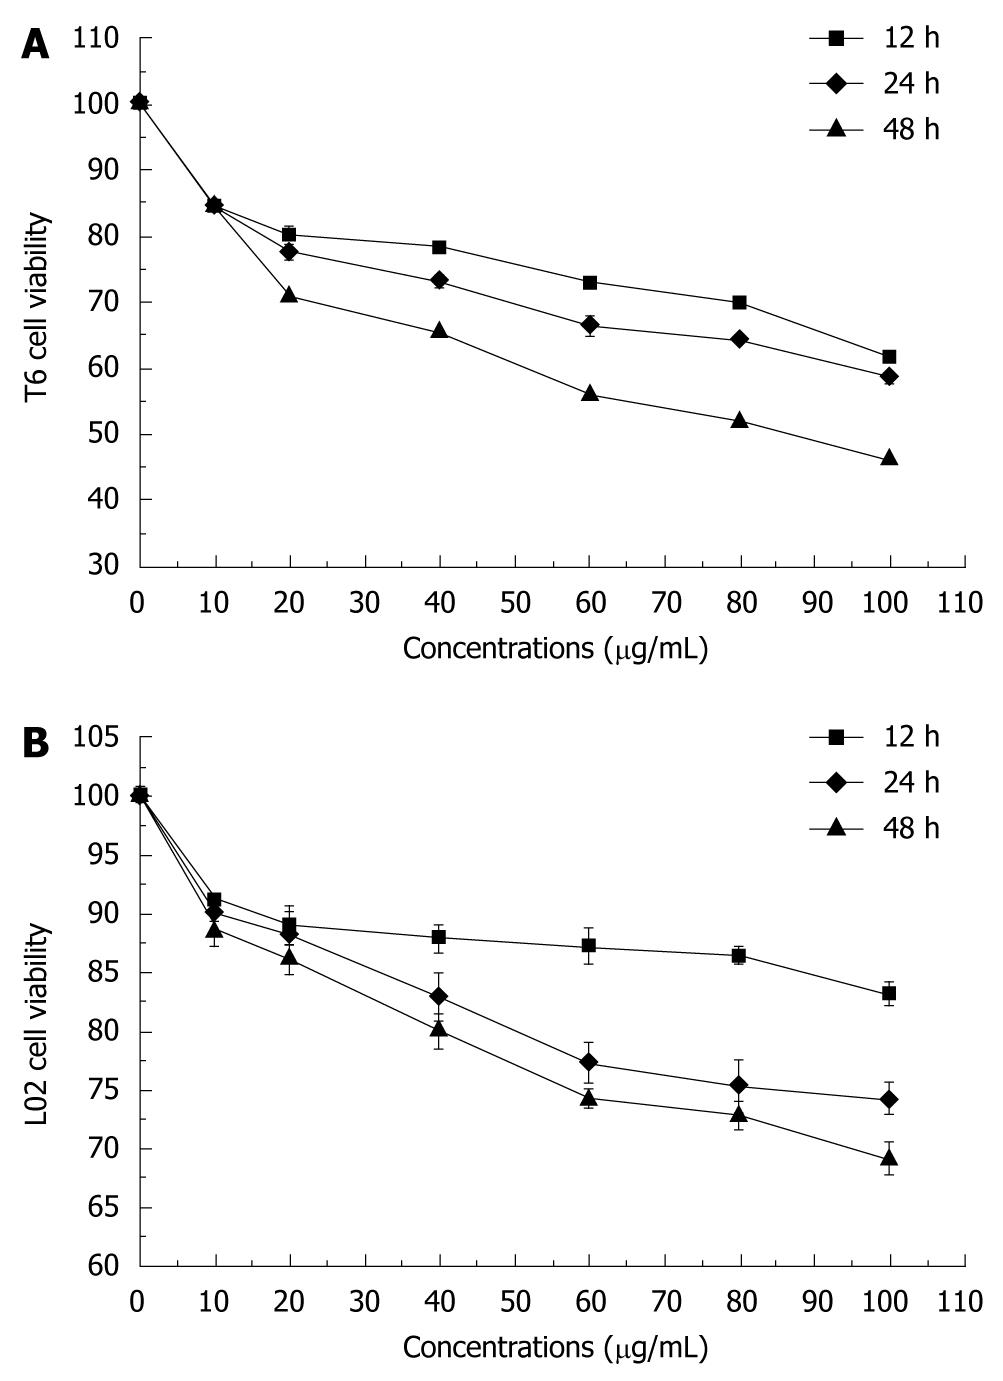
Figure 1 Effects of tectorigenin on the viability of hepatic stellate cell -T6 (A) and -L02 cells (B).
Cells were treated for 12, 24 and 48 h with tectorigenin at 10, 20, 40, 60, 80 and 100 μg/mL, respectively, followed by assessing the cell viability relative to that of untreated cells (= control). Bars represent mean ± SD.
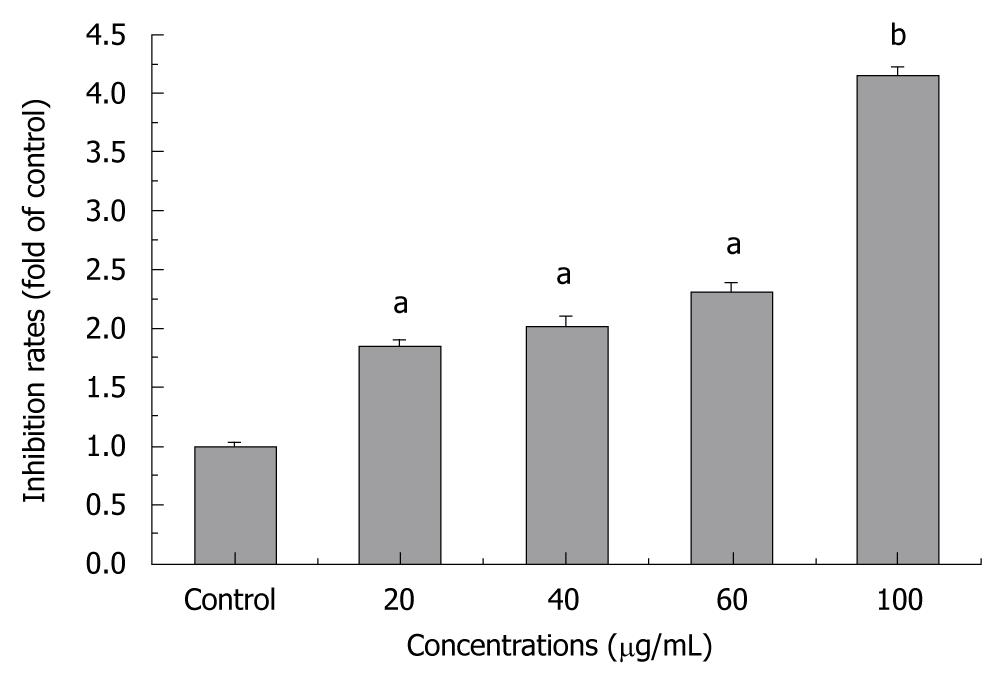
Figure 2 Proliferative inhibition of tectorigenin on hepatic stellate cells-T6 cells.
Cells were treated for 48 h with tectorigenin at 0, 20, 40, 60 and 100 μg/mL, respectively. Data are expressed as fold increase over that of untreated cells. Bars represent mean ± SD (aP < 0.05, bP < 0.01).
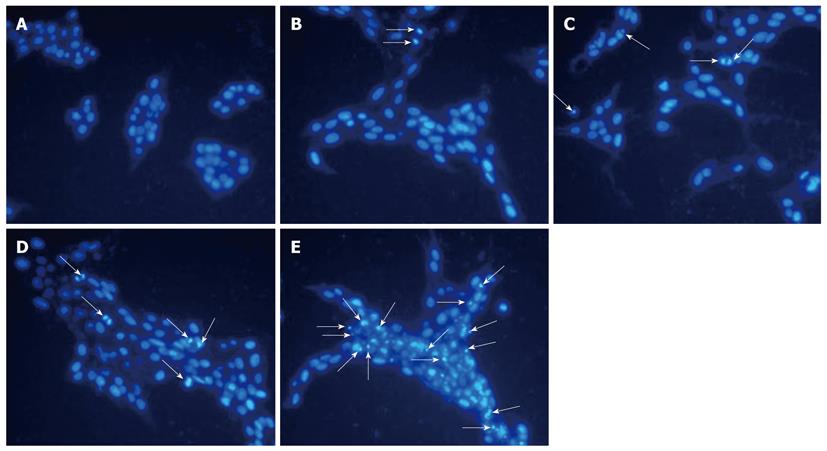
Figure 3 Fluorescent staining of nuclei in hepatic stellate cells-T6 cells (200 ×).
Cells were treated with tectorigenin for 48 h at 0 μg/mL (A), 20 μg/mL (B), 40 μg/mL (C), 60 μg/mL (D) and 100 μg/mL (E), respectively. The arrows in B-E indicate the apoptotic cells.
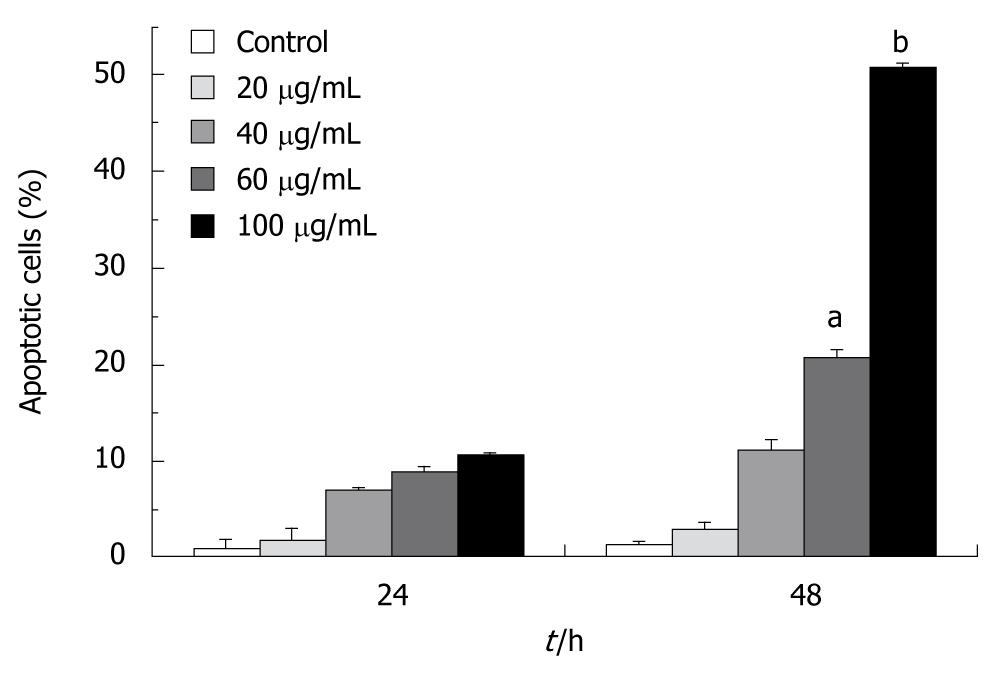
Figure 4 Flow cytometry-evidenced apoptosis of hepatic stellate cells-T6 cells upon exposure to tectorigenin.
Cells were incubated for 24 and 48 h with tectorigenin at 20, 40, 60 and 100 μg/mL, respectively, followed by being stained with fluorescein isothiocyanate-conjugated annexin V and propidium iodide. Bars represent mean ± SD (aP < 0.05, bP < 0.01).
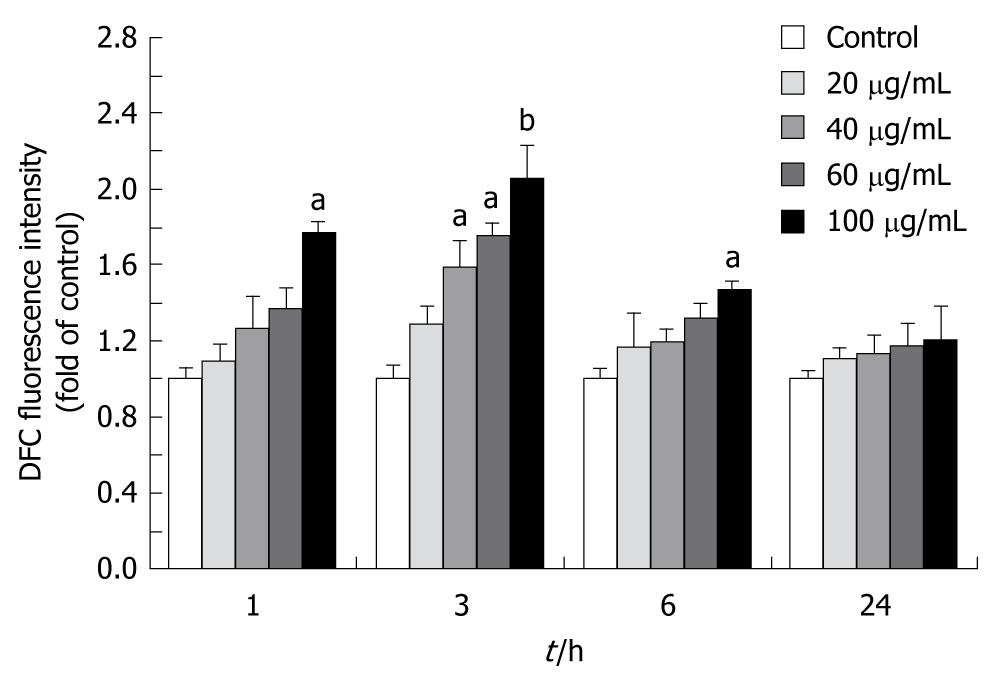
Figure 5 Tectorigenin produces reactive oxygen species in hepatic stellate cells-T6 cells.
Cells were treated with tectorigenin for 1, 3, 6 and 24 h, followed by a 30-min incubation at 37°C with reactive oxygen species detected by dichlorodihydrofluorescein diacetate. Data are expressed as fold increase over that of untreated cells. Bars represent mean ± SD (aP < 0.05, bP < 0.01).
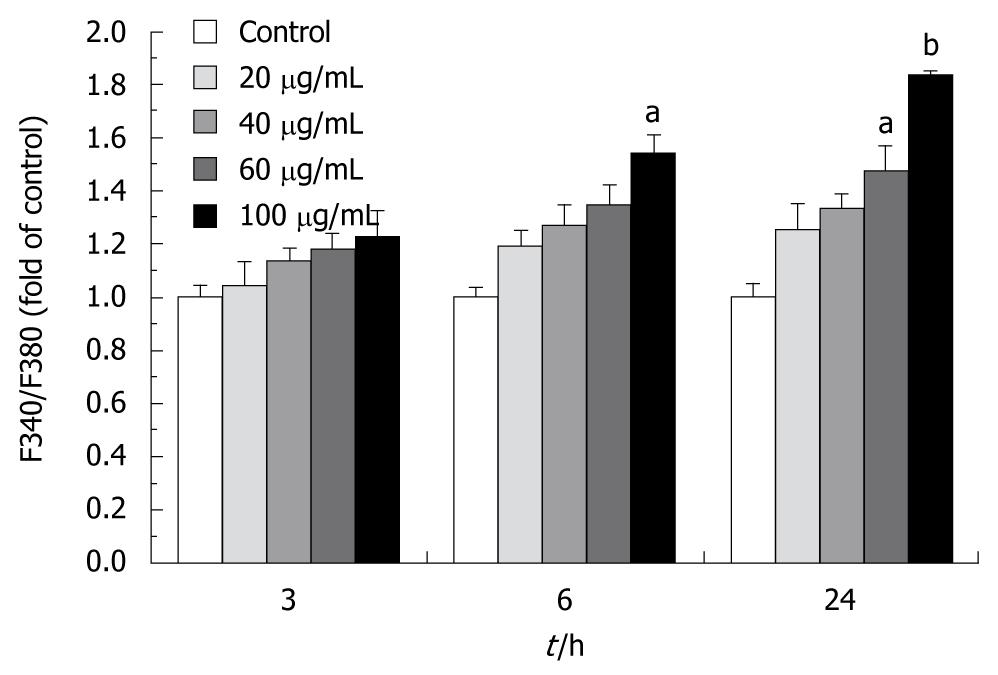
Figure 6 Tectorigenin increases [Ca2+]i in hepatic stellate cells-T6 cells.
Cells were treated with tectorigenin for 3, 6 and 24 h. [Ca2+]i was detected by Fura-2/AM 380nm/340nm fluorescence ratio (F340/F380). Data are expressed as fold increase over that of untreated cells. Bars represent mean ± SD (aP < 0.05, bP < 0.01).
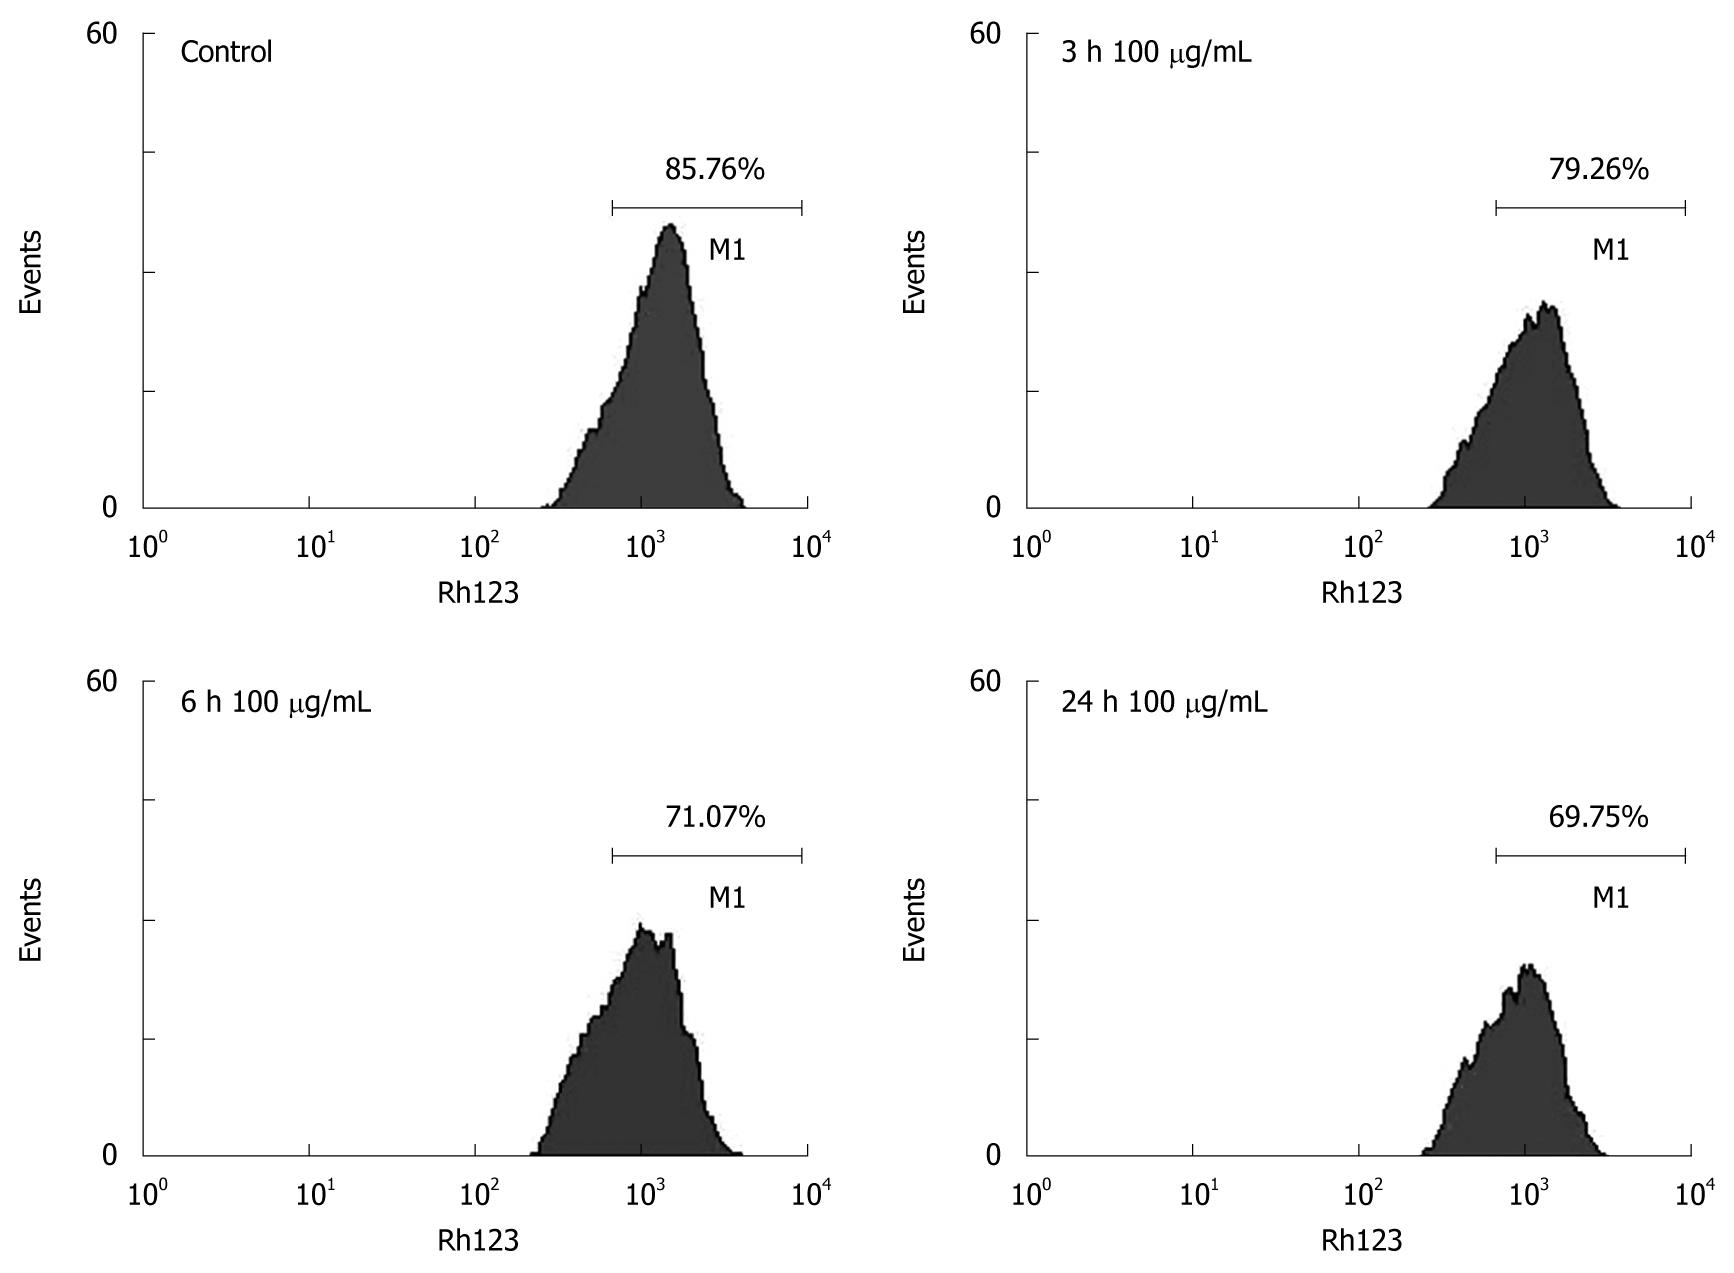
Figure 7 Tectorigenin reduces mitochondrial membrane potential in hepatic stellate cells-T6 cells.
After treated with tectorigenin at 100 μg/mL for 3, 6 and 24 h, respectively, cells were harvested and stained with Rhodamine 123 to determine mitochondrial membrane potential by flow cytometry.
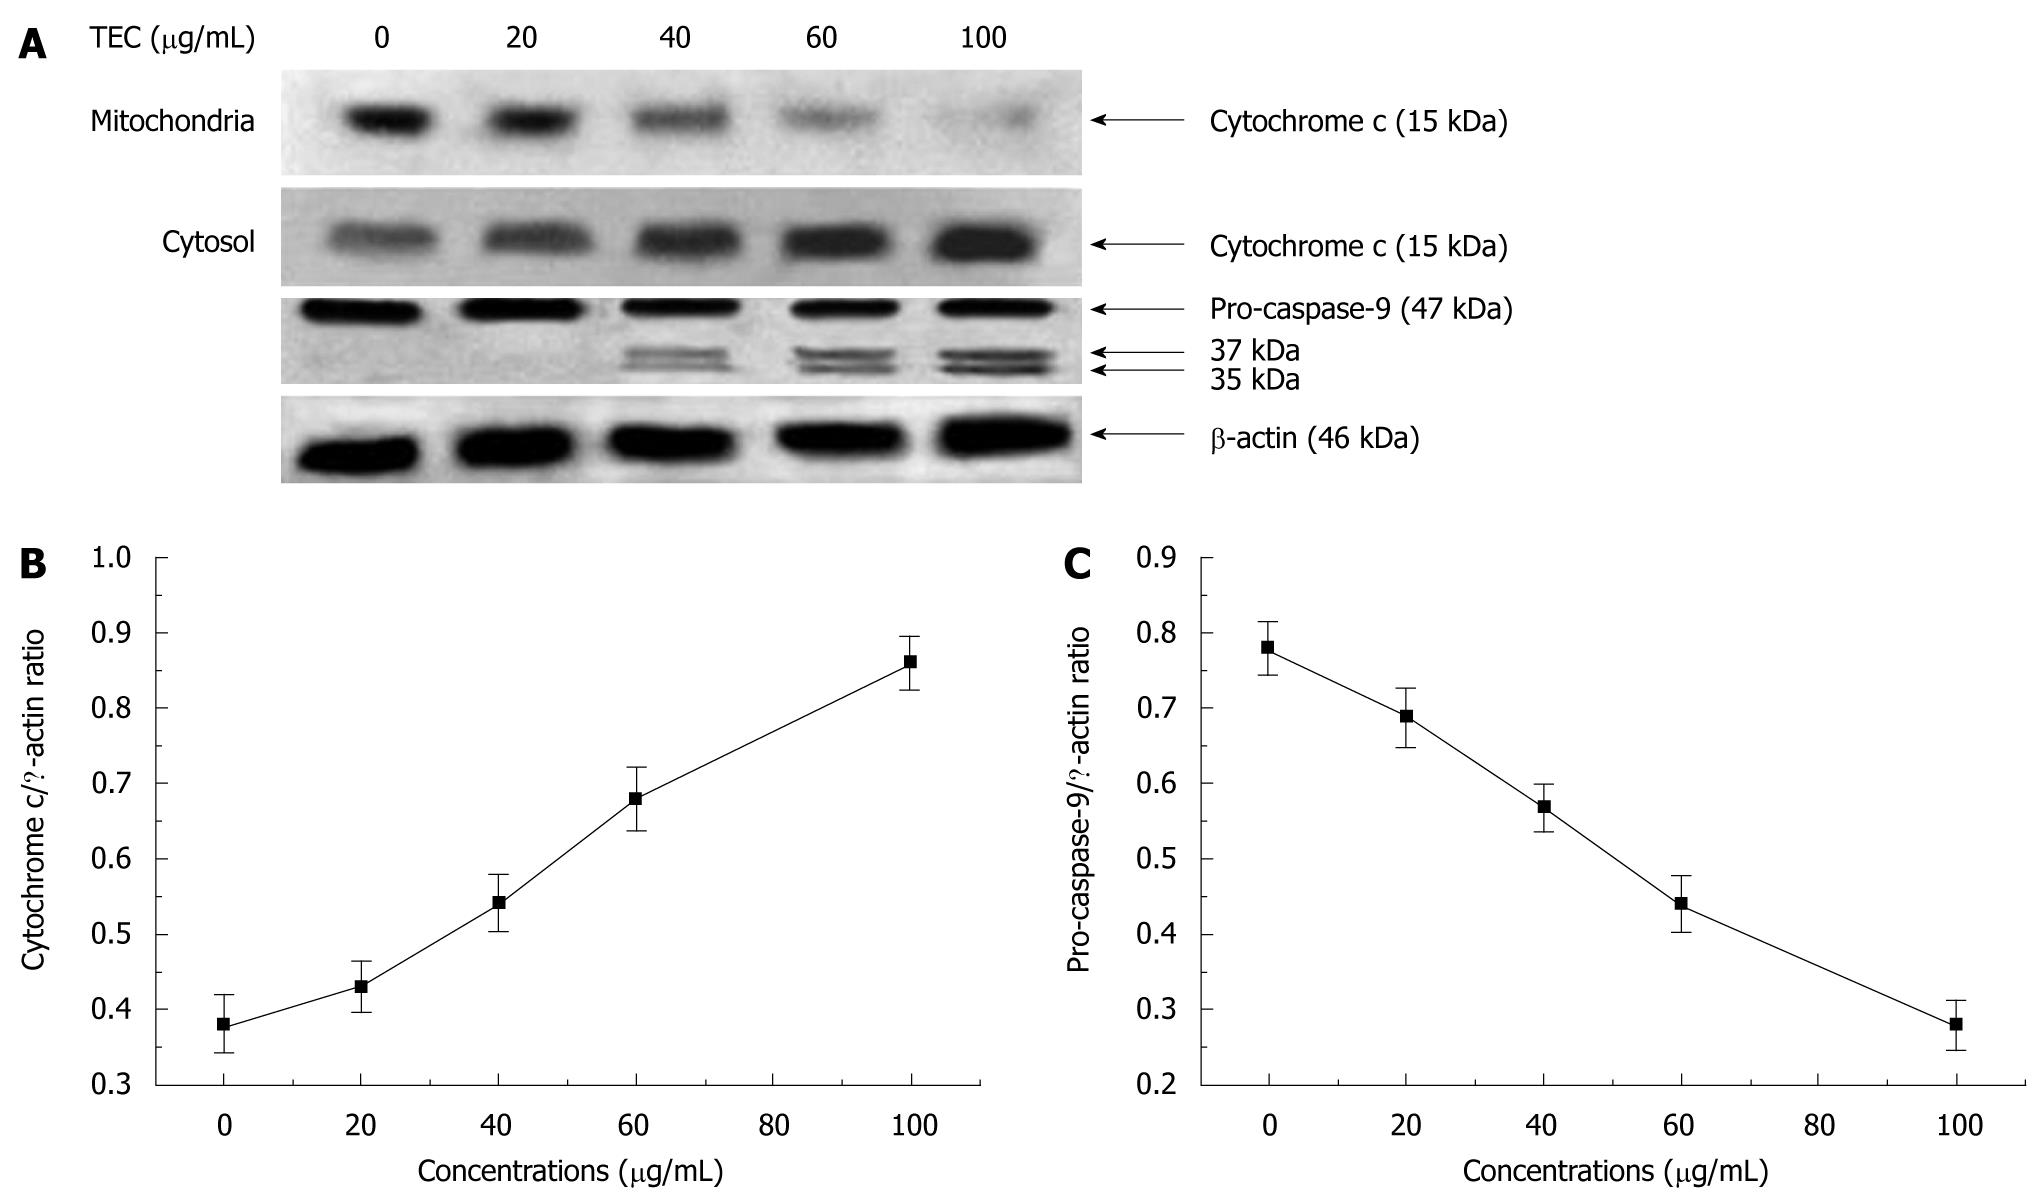
Figure 8 Western blotting analysis.
After 48-h exposure to tectorigenin at 0, 20, 40, 60 and 100 μg/mL, respectively, levels of cytochrome c and caspase-9 in hepatic stellate cells-T6 cells (A), along with those of cytochrome c (B) and pro-caspase-9 (C) in cytosol, were evaluated. Protein (30 μg) from each sample was resolved on 12% SDS-PAGE and β-actin was used as a loading control.
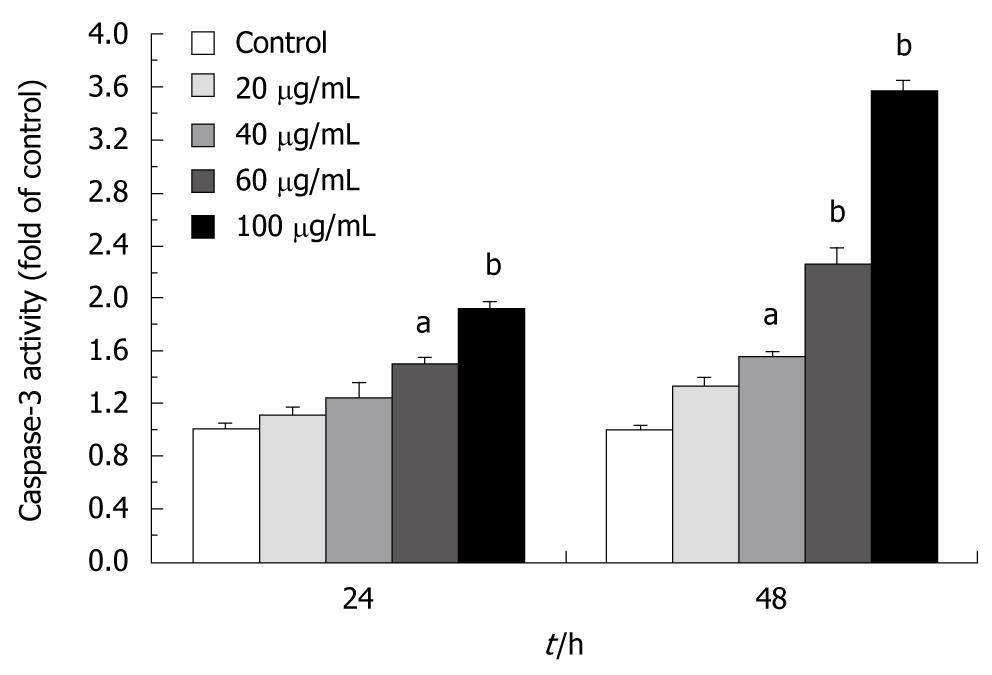
Figure 9 Tectorigenin activates pro-caspase-3 in hepatic stellate cells-T6 cells.
Cells were treated for 24 and 48 h with tectorigenin at 0, 20, 40, 60 and 100 μg/mL, respectively. Data are expressed as fold increase over that of untreated cells. Bars represent mean ± SD (aP < 0.05, bP < 0.01).
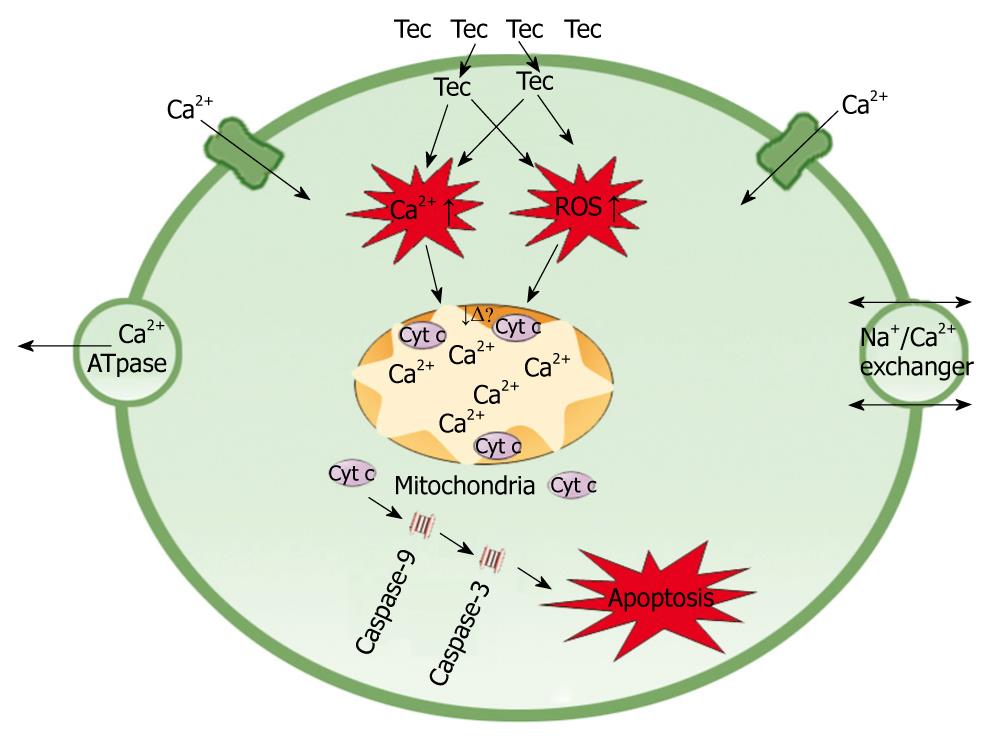
Figure 10 Tectorigenin produces reactive oxygen species and increases Ca2+ concentration in cytoplasm of hepatic stellate cells-T6 cells, leading to the depletion of mitochondrial membrane potential and release of cytochrome c from mitochondria.
Cytochrome c facilitates apoptosis of hepatic stellate cells-T6 cells by activating caspase cascade. ROS: Reactive oxygen species.
- Citation: Wu JH, Wang YR, Huang WY, Tan RX. Anti-proliferative and pro-apoptotic effects of tectorigenin on hepatic stellate cells. World J Gastroenterol 2010; 16(31): 3911-3918
- URL: https://www.wjgnet.com/1007-9327/full/v16/i31/3911.htm
- DOI: https://dx.doi.org/10.3748/wjg.v16.i31.3911


