Copyright
©2010 Baishideng.
World J Gastroenterol. Jan 21, 2010; 16(3): 348-353
Published online Jan 21, 2010. doi: 10.3748/wjg.v16.i3.348
Published online Jan 21, 2010. doi: 10.3748/wjg.v16.i3.348
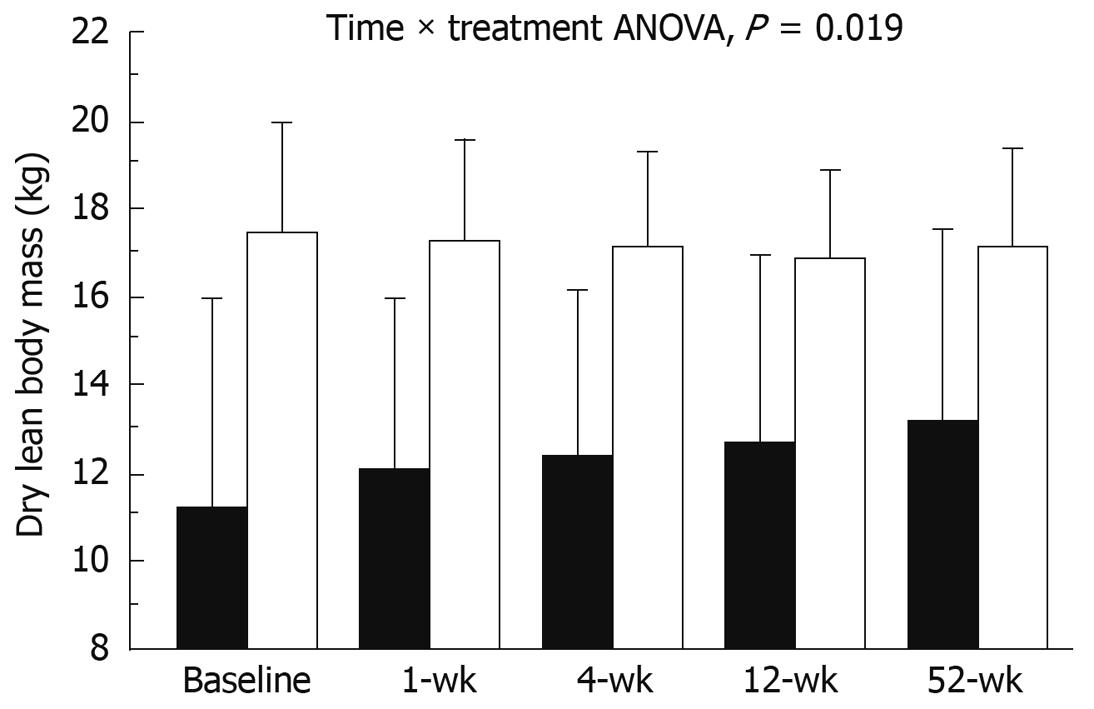
Figure 1 Time course of dry lean body mass in normal weight (black bars) and overweight subjects (white bars) following the TIPS procedure.
The data are presented as means and standard error. Trend shows significant difference (P = 0.019).
- Citation: Montomoli J, Holland-Fischer P, Bianchi G, Grønbæk H, Vilstrup H, Marchesini G, Zoli M. Body composition changes after transjugular intrahepatic portosystemic shunt in patients with cirrhosis. World J Gastroenterol 2010; 16(3): 348-353
- URL: https://www.wjgnet.com/1007-9327/full/v16/i3/348.htm
- DOI: https://dx.doi.org/10.3748/wjg.v16.i3.348


