Copyright
©2010 Baishideng.
World J Gastroenterol. Jul 28, 2010; 16(28): 3491-3498
Published online Jul 28, 2010. doi: 10.3748/wjg.v16.i28.3491
Published online Jul 28, 2010. doi: 10.3748/wjg.v16.i28.3491
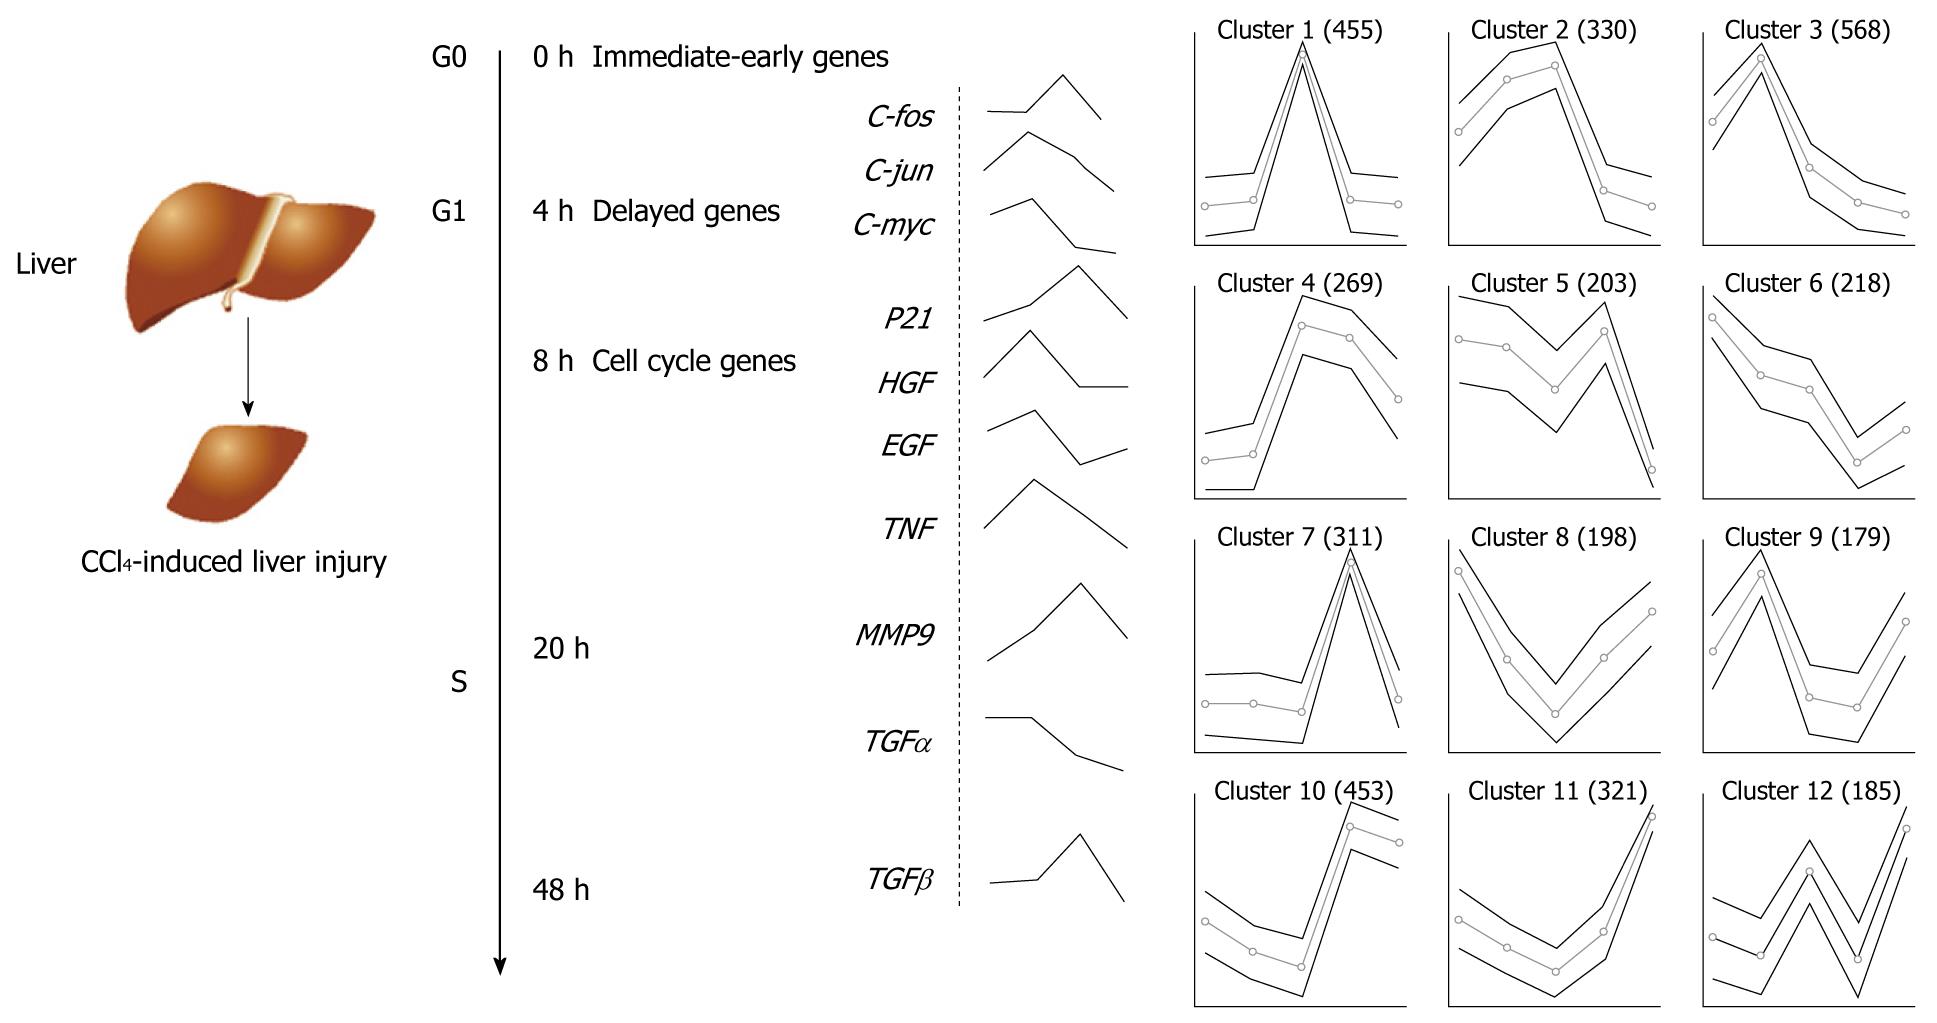
Figure 1 Hepatocyte cell cycle during liver regeneration and clustering algorithm of gene expressions in gene chip during mouse liver regeneration following CCl4-induced liver injury.
Some important genes are activated in the regenerating liver after partial hepatectomy or hepatocellular injury induced by CCl4. Liver regeneration can be divided into four phases: G0: Corresponds to approximately the first 4 h; G1: Quiescent cells enter the cell cycle during production of hepatocyte growth factor (HGF), epidermal growth factor (EGF), tumor necrosis factor (TNF), etc.; S: Chromosomal DNA is replicated and peak DNA production occurs at approximately 24 h; then, after 48 h or more, the process of regeneration is terminated. The curves following the gene products and the dashed line represent the changes in gene expressions measured in our lab using Gene Chip® mouse 430 2.0 during liver regeneration following CCl4-induced liver injury. Changes on the level of gene expression were log2-transformed using signal value at 0 h time-point as baseline. Genes with their expression levels varying at least 2-fold between any two time-points were subjected to hierarchical clustering analysis. TGF: Transforming growth factor; MMP9: Matrix metalloproteinase 9.
Figure 2 The classical and basic view of transforming growth factor β signaling pathway during liver regeneration.
Generally speaking, transforming growth factor β (TGFβ) superfamily ligands bind to a type II receptor (RII), which recruits and phosphorylates a RI. The RI then phosphorylates receptor-regulated Smads. Then complexes accumulate in the nucleus where they act as transcription factors and participate in the regulation of target gene expression.
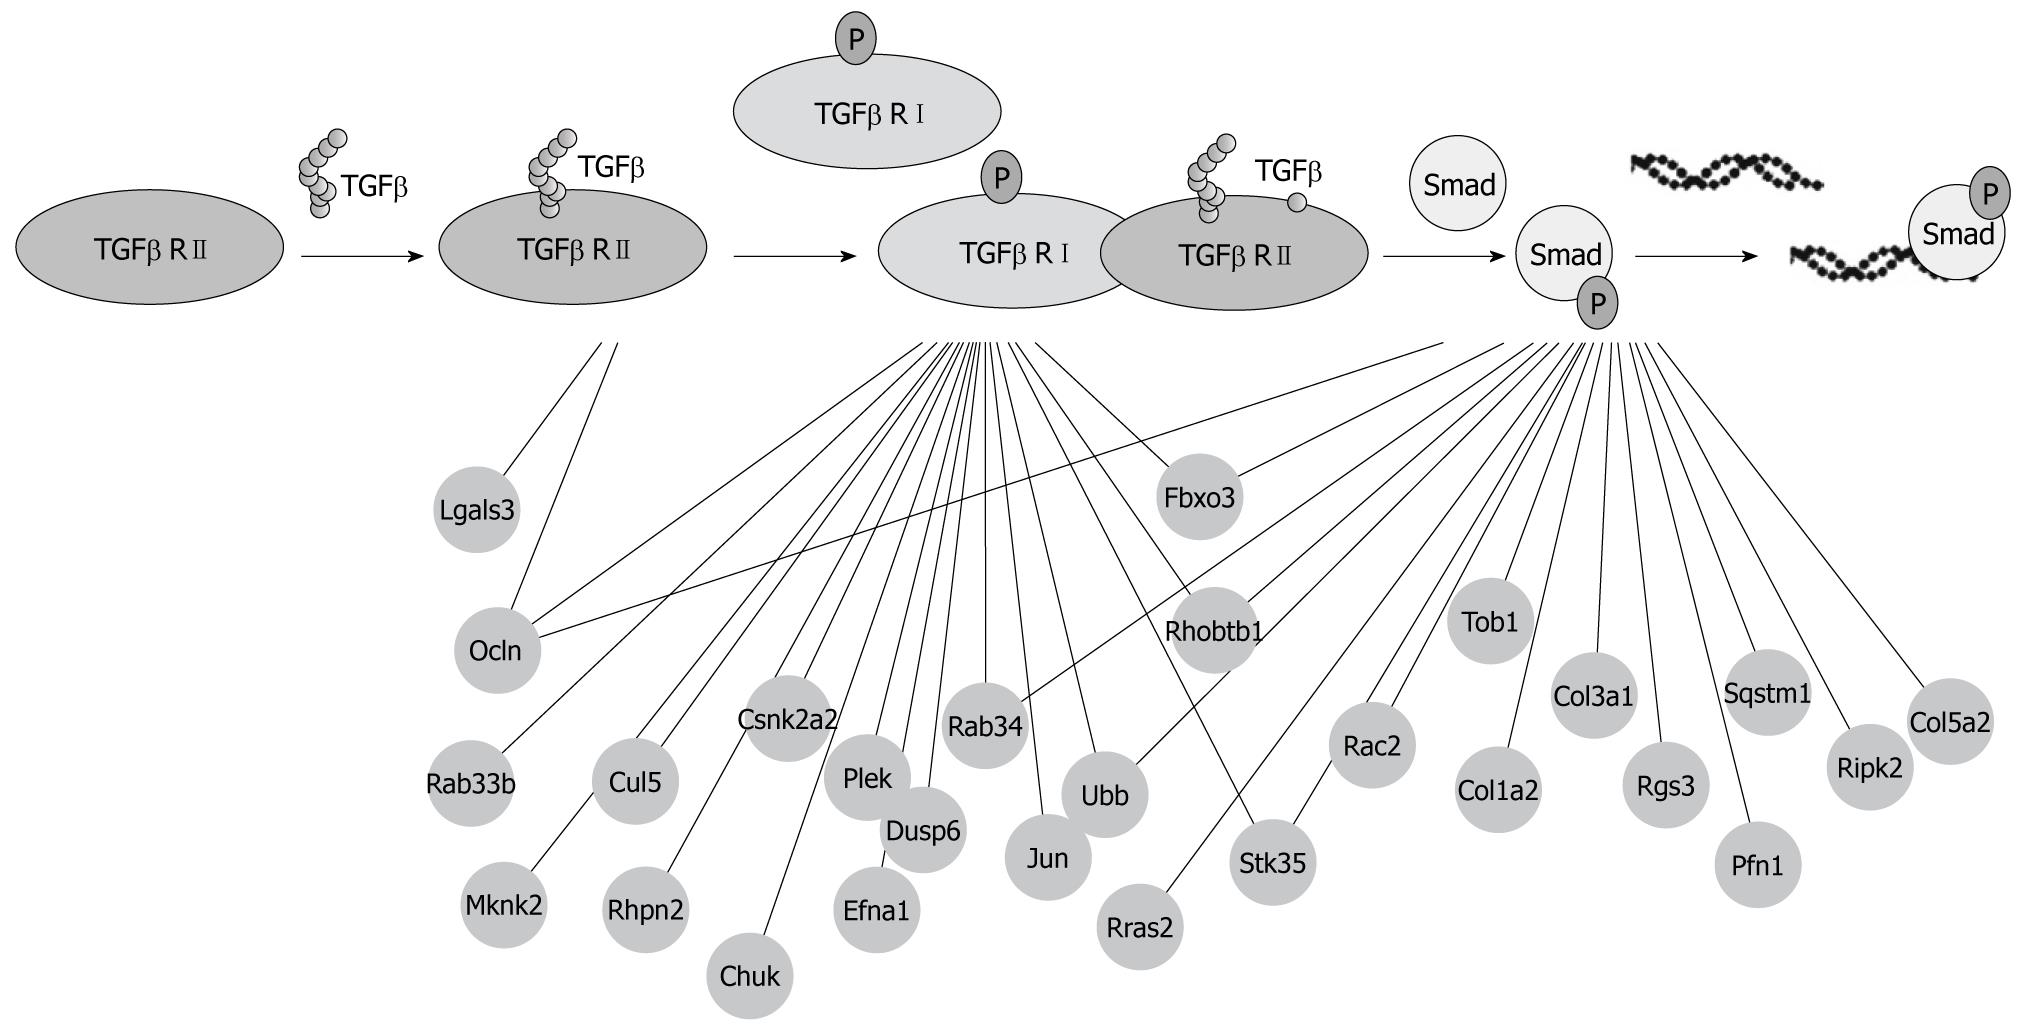
Figure 3 A protein-protein interaction comprising the transforming growth factor β signaling pathway.
This figure just lists the protein-protein interactions which correlated with transforming growth factor β type I receptor (TGFβ RI), TGFβ RII and Smads and all the proteins that directly interact with these three proteins which indicate that additional partners are not represented in this figure.
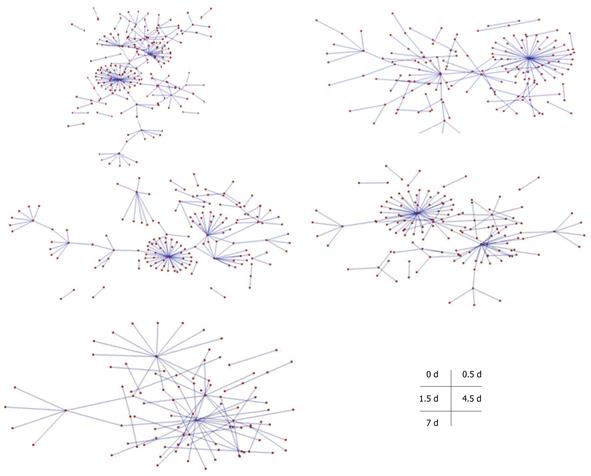
Figure 4 Protein-protein interaction maps comprising the transforming growth factor β signaling pathway of transcription factors associated with liver cell proliferation.
The protein-protein interaction maps consist of different stages of liver regeneration (0 d, 0.5 d, 1.5 d, 4.5 d and 7 d after CCl4-induced liver injury).
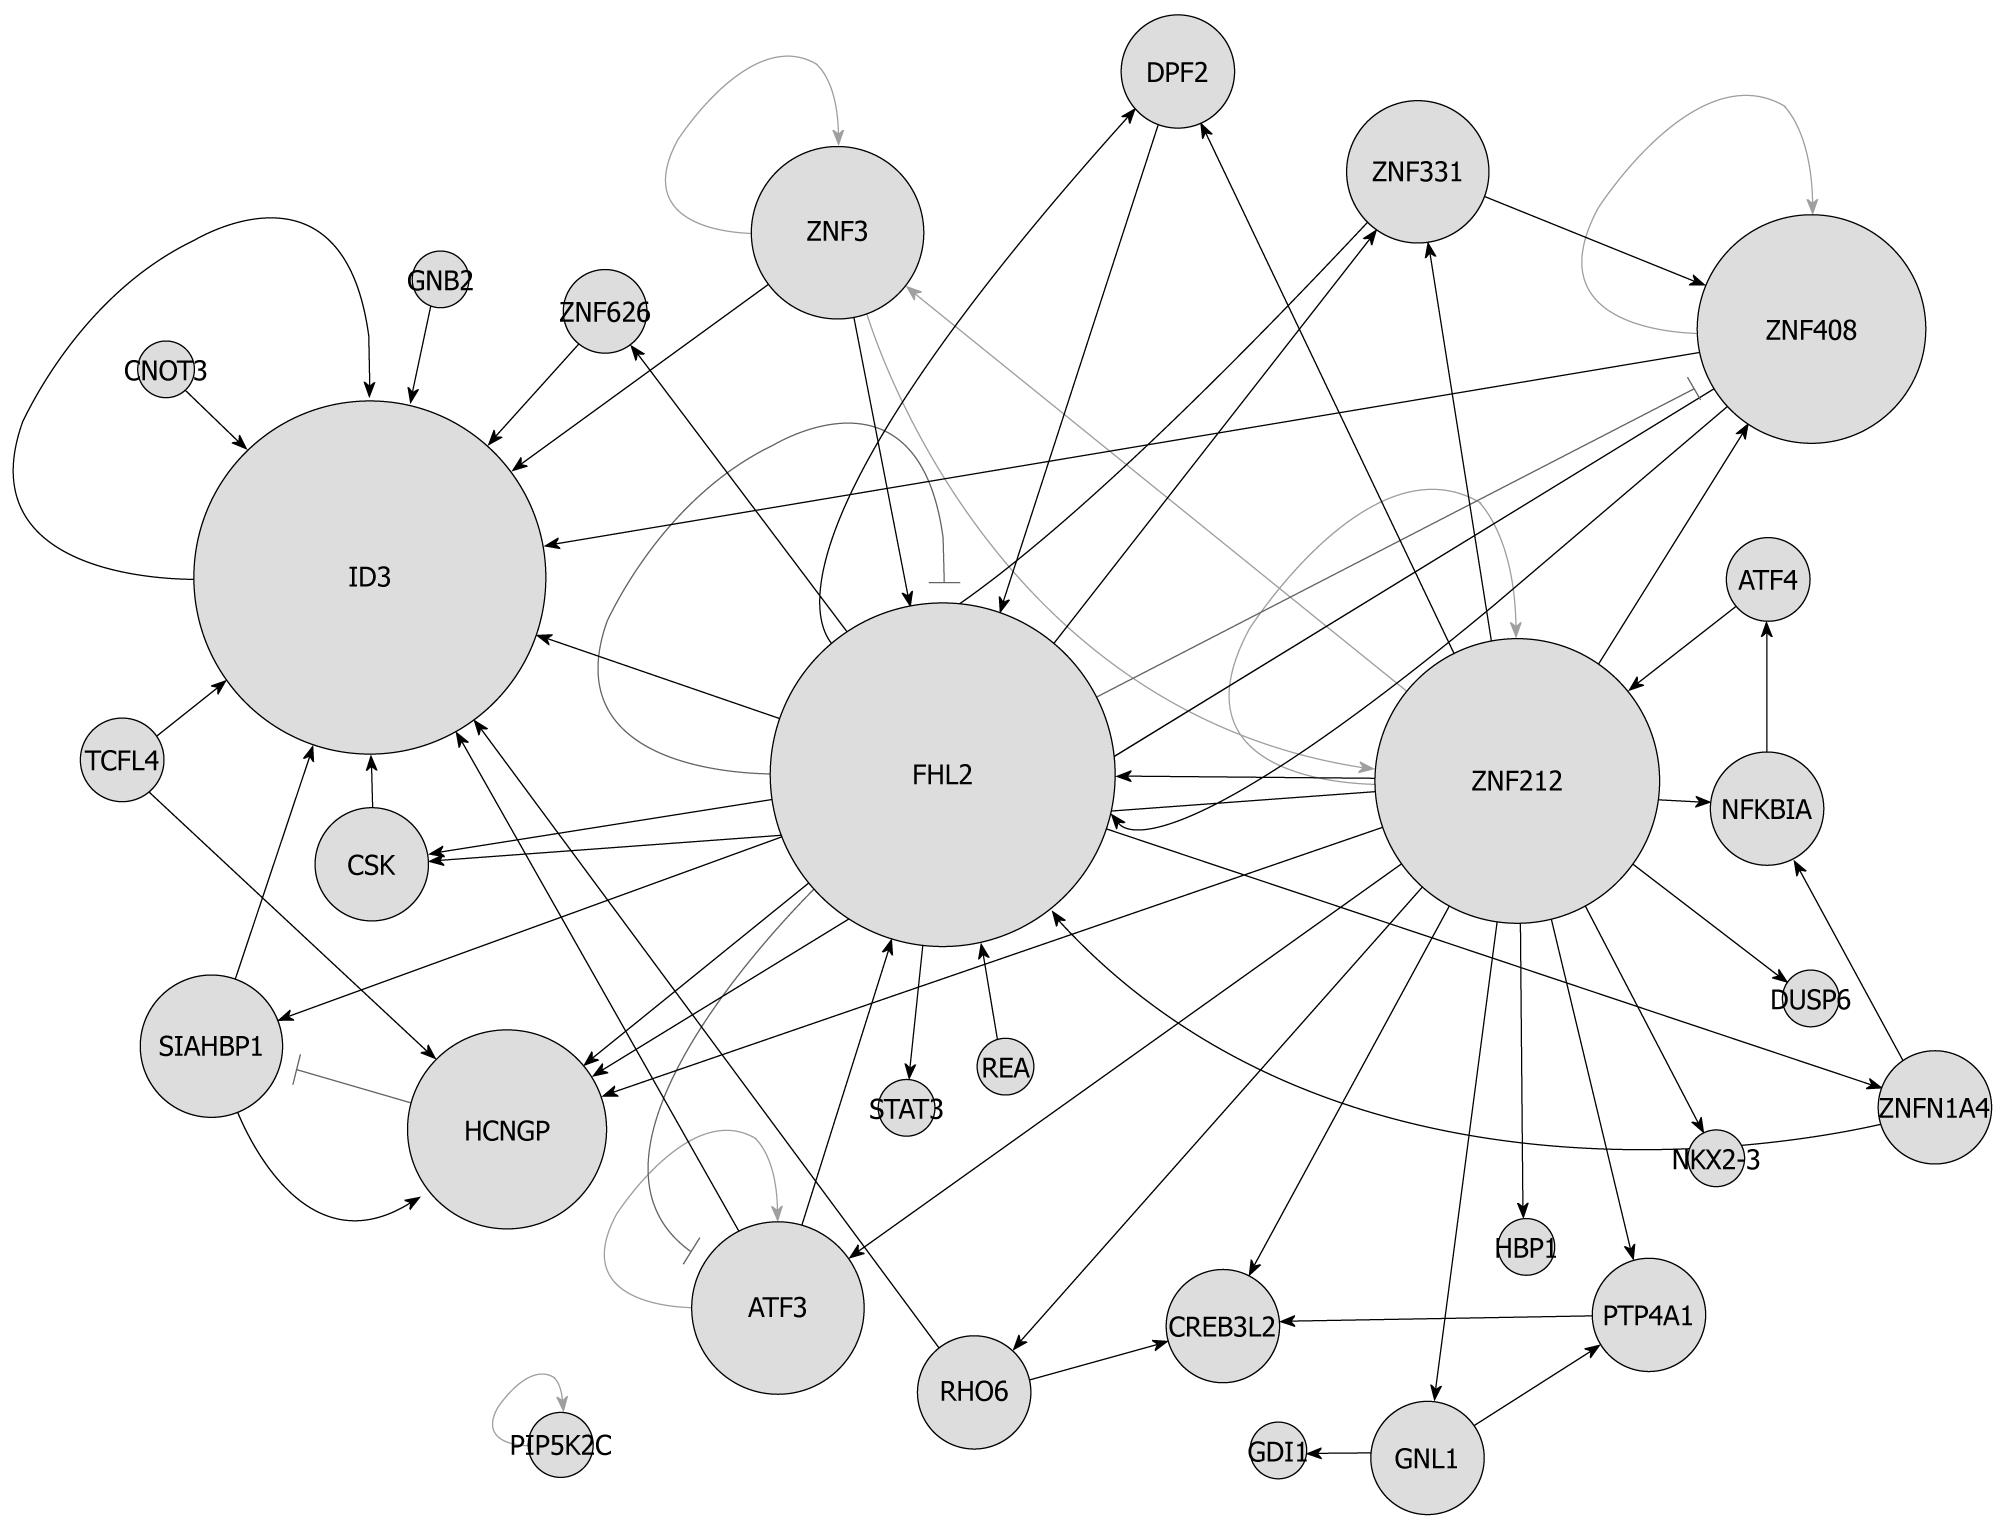
Figure 5 A protein-protein interaction map of transcription factors associated with liver cell proliferation.
Node stands for protein and the edge means the two proteins are interactive; the node size symbolizes the degree of this protein (the more highly connected with others, the bigger node); the edge target arrow shape and color: delta and blue, interactions are only validated by yeast two-hybrid (Y2H); diamond and green means validated by Y2H and α-glutathione S-transferase pull-down; T and black means validated by Y2H and co-immunoprecipitation.
- Citation: Xie C, Gao J, Zhu RZ, Yuan YS, He HL, Huang QS, Han W, Yu Y. Protein-protein interaction map is a key gateway into liver regeneration. World J Gastroenterol 2010; 16(28): 3491-3498
- URL: https://www.wjgnet.com/1007-9327/full/v16/i28/3491.htm
- DOI: https://dx.doi.org/10.3748/wjg.v16.i28.3491


