Copyright
©2010 Baishideng.
World J Gastroenterol. Jul 14, 2010; 16(26): 3330-3334
Published online Jul 14, 2010. doi: 10.3748/wjg.v16.i26.3330
Published online Jul 14, 2010. doi: 10.3748/wjg.v16.i26.3330
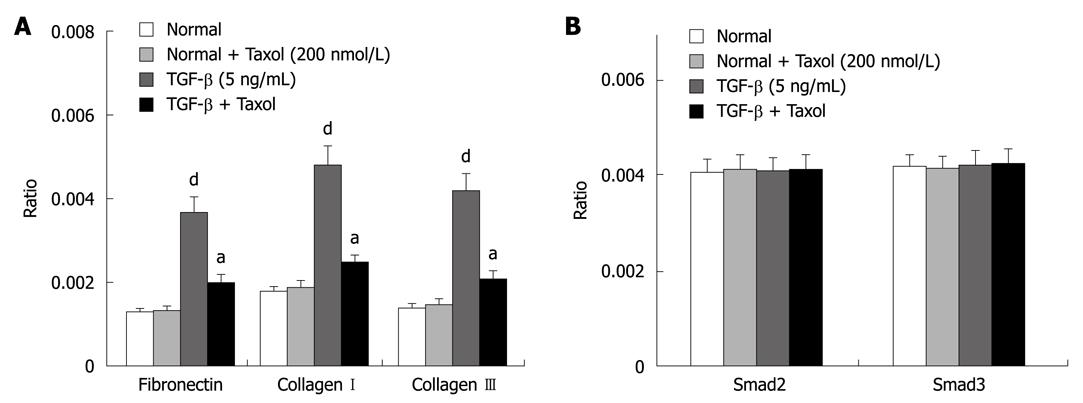
Figure 1 The mRNA levels changes in vitro after treatment.
A: Real-time PCR depicting fibronectin and collagen I and III mRNA expression in vitro following paclitaxel treatment of hepatic stellate cells (HSCs). Fibronectin and collagen I and III expression was significantly higher in the TGF-β group at 48 h compared with the normal or Taxol groups (P < 0.05, n = 6). Treatment with paclitaxel resulted in a decrease in fibronection and collagen I and III expression (P < 0.05, n = 6). aP < 0.05 vs TGF-β group; dP < 0.01 vs normal or Taxol group (n = 6); B: Real-time PCR showing Smad2 (left) and Smad3 (right) mRNA expression in vitro following treatment with paclitaxel in HSCs. Smad2 and Smad3 mRNA expression was more or less similar in the normal and Taxol groups at 48 h (P < 0.05, n = 6). Densitometric analyses were performed from six independent experiments. Each bar represents the mean ± SD for six animals. PCR: Polymerase chain reaction; TGF-β: Transforming growth factor β.
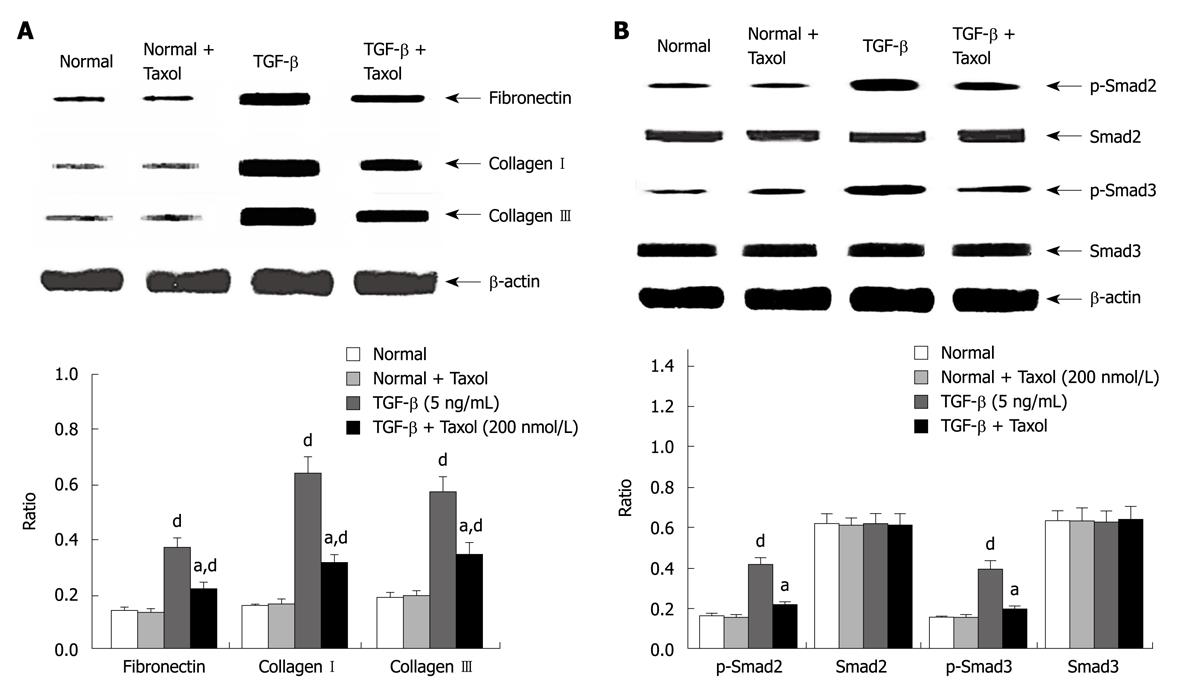
Figure 2 The protein levels changes in vitro after treatment.
A: Western blotting analyses depicting fibronectin and collagen I and III mRNA expression in vitro following paclitaxel treatment in HSCs. Whole hepatic cell extracts were immunoblotted with the indicated antibodies. Fibronectin and collagen I and III expression was significantly higher in the TGF-β group at 48 h compared with the normal or Taxol group (P < 0.05, n = 6). Treatment with paclitaxel resulted in a decrease in fibronectin and collagen I and III expression (P < 0.05, n = 6); B: Western blotting analysis showing Smad2/3 protein expression in vitro following treatment with paclitaxel in HSCs. Phosphorylated Smad2 and Smad3 but not total Smad2 or Smad3 expression was significantly higher in the TGF-β group at 48 h compared with the normal or Taxol group (P < 0.05, n = 6). Treatment with paclitaxel resulted in a decrease in phosphorylation of Smad2 and Smad3 (P < 0.05, n = 6). Densitometric analyses were performed from six independent experiments. Each bar represents the mean ± SD for six animals. aP < 0.05 vs TGF-β group; dP < 0.01 vs normal or Taxol group (n = 6).
-
Citation: Zhou J, Zhong DW, Wang QW, Miao XY, Xu XD. Paclitaxel ameliorates fibrosis in hepatic stellate cells
via inhibition of TGF-β/Smad activity. World J Gastroenterol 2010; 16(26): 3330-3334 - URL: https://www.wjgnet.com/1007-9327/full/v16/i26/3330.htm
- DOI: https://dx.doi.org/10.3748/wjg.v16.i26.3330


