Copyright
©2010 Baishideng.
World J Gastroenterol. Jul 14, 2010; 16(26): 3292-3298
Published online Jul 14, 2010. doi: 10.3748/wjg.v16.i26.3292
Published online Jul 14, 2010. doi: 10.3748/wjg.v16.i26.3292
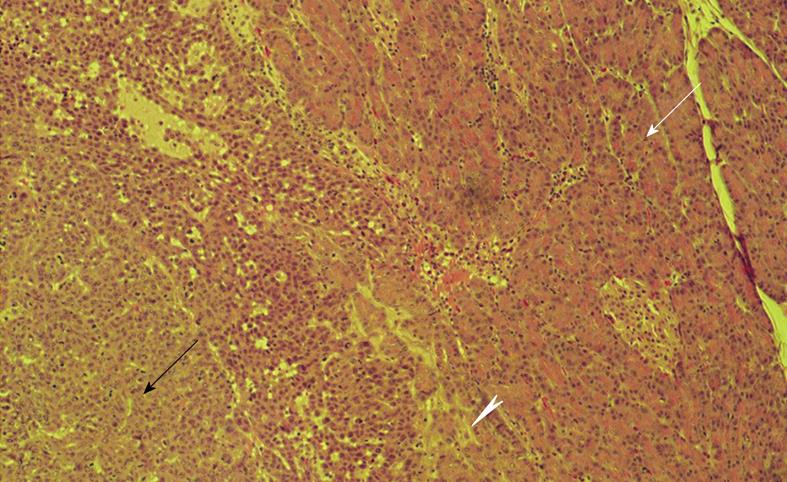
Figure 1 Histopathologic image obtained at necropsy.
Border between viable VX2 tumor cells (black arrow) and healthy pancreatic tissue (white arrow) with irritated pancreatitis-like tissue at the tumor-pancreas interface (arrowhead). Note islet of Langerhans within healthy pancreatic tissue. Hematoxylin-eosin stain; original magnification × 25.
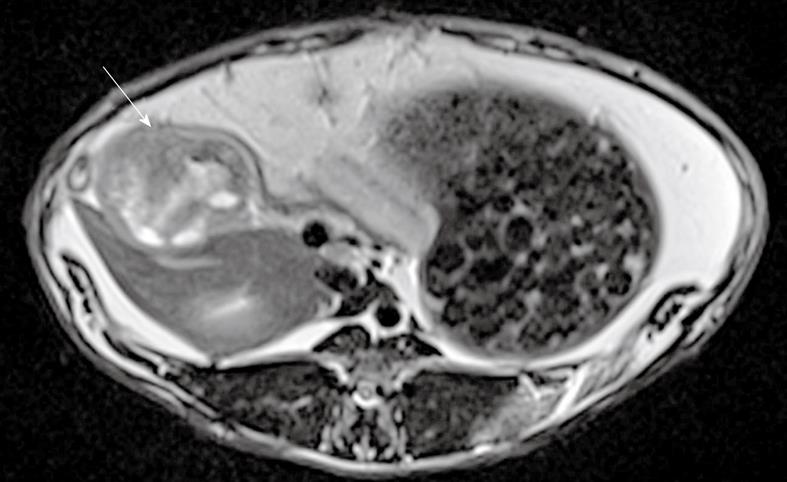
Figure 2 T2-weighted turbo spin echo magnetic resonance imaging showing pancreatic tumor (arrow) in axial view.
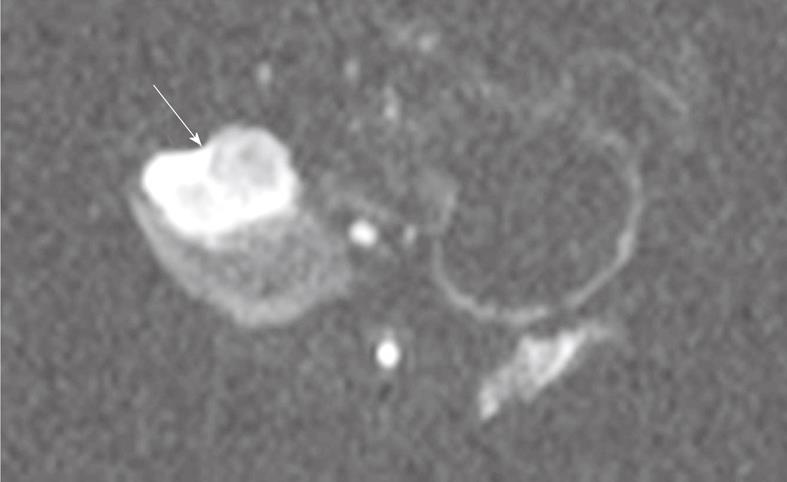
Figure 3 Single shot spin-echo planar diffusion weighted MRI (b = 500 s/mm2) showing pancreatic tumor (arrow) in axial view.
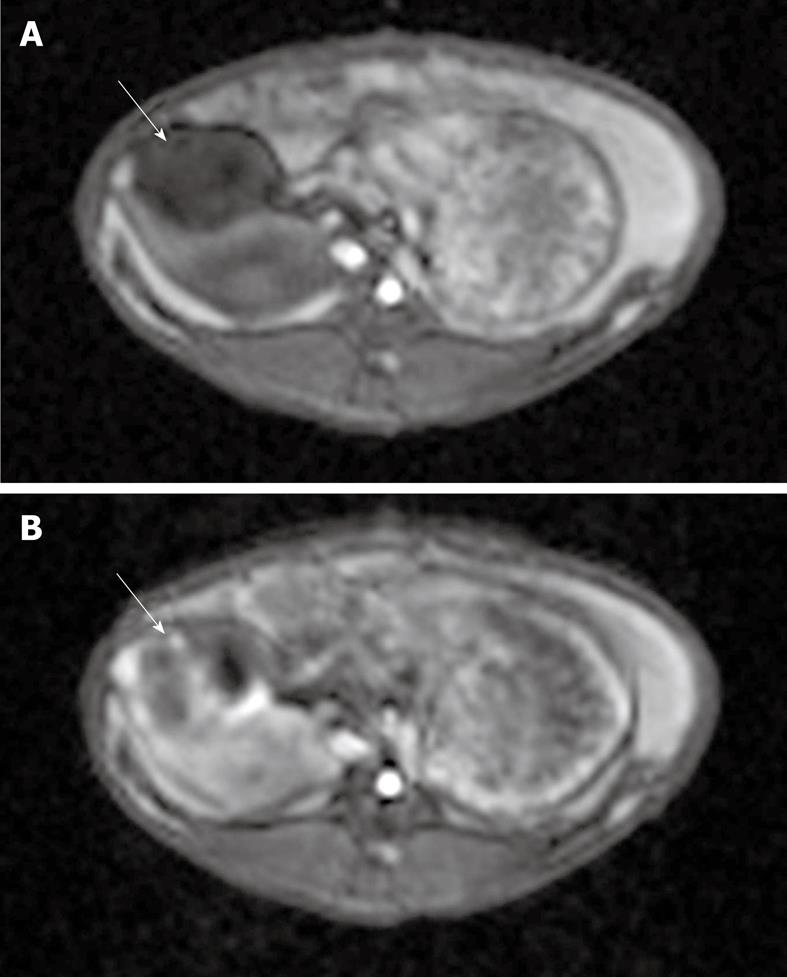
Figure 4 T1-weighted gradient-echo magnetic resonance [taken before (A) and after (B) TRIP imaging occurred].
Each image shows a VX2 tumor (solid arrows) located in the pancreas. Note the areas of increased perfusion to the viable tumor periphery in image B.
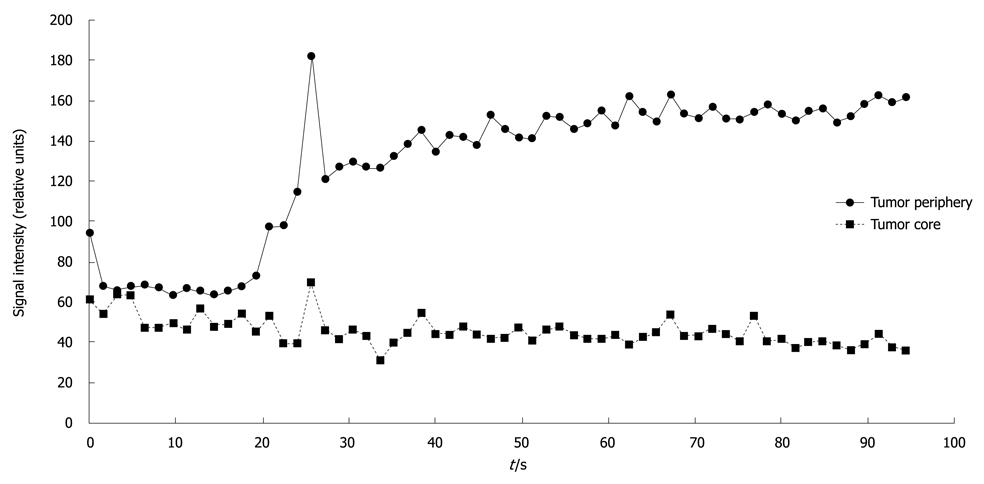
Figure 5 Signal intensity vs time curve for one pancreatic tumor, depicting higher signal intensity in the viable tumor periphery than in the necrotic tumor core.
- Citation: Lewandowski RJ, Eifler AC, Bentrem DJ, Chung JC, Wang D, Woloschak GE, Yang GY, Ryu R, Salem R, Larson AC, Omary RA. Functional magnetic resonance imaging in an animal model of pancreatic cancer. World J Gastroenterol 2010; 16(26): 3292-3298
- URL: https://www.wjgnet.com/1007-9327/full/v16/i26/3292.htm
- DOI: https://dx.doi.org/10.3748/wjg.v16.i26.3292


