Copyright
©2010 Baishideng.
World J Gastroenterol. Jul 7, 2010; 16(25): 3153-3160
Published online Jul 7, 2010. doi: 10.3748/wjg.v16.i25.3153
Published online Jul 7, 2010. doi: 10.3748/wjg.v16.i25.3153
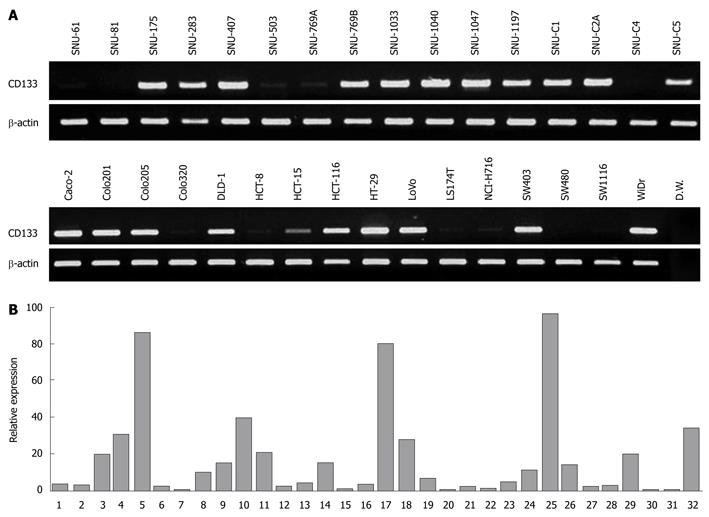
Figure 2 Expression analysis of CD133 gene in 32 colorectal cancer cell lines.
A: Reverse transcription-polymerase chain reaction (RT-PCR) analysis of the CD133 gene in 32 colorectal cell lines; B: Quantitative differences of CD133 expression by real-time PCR analysis.
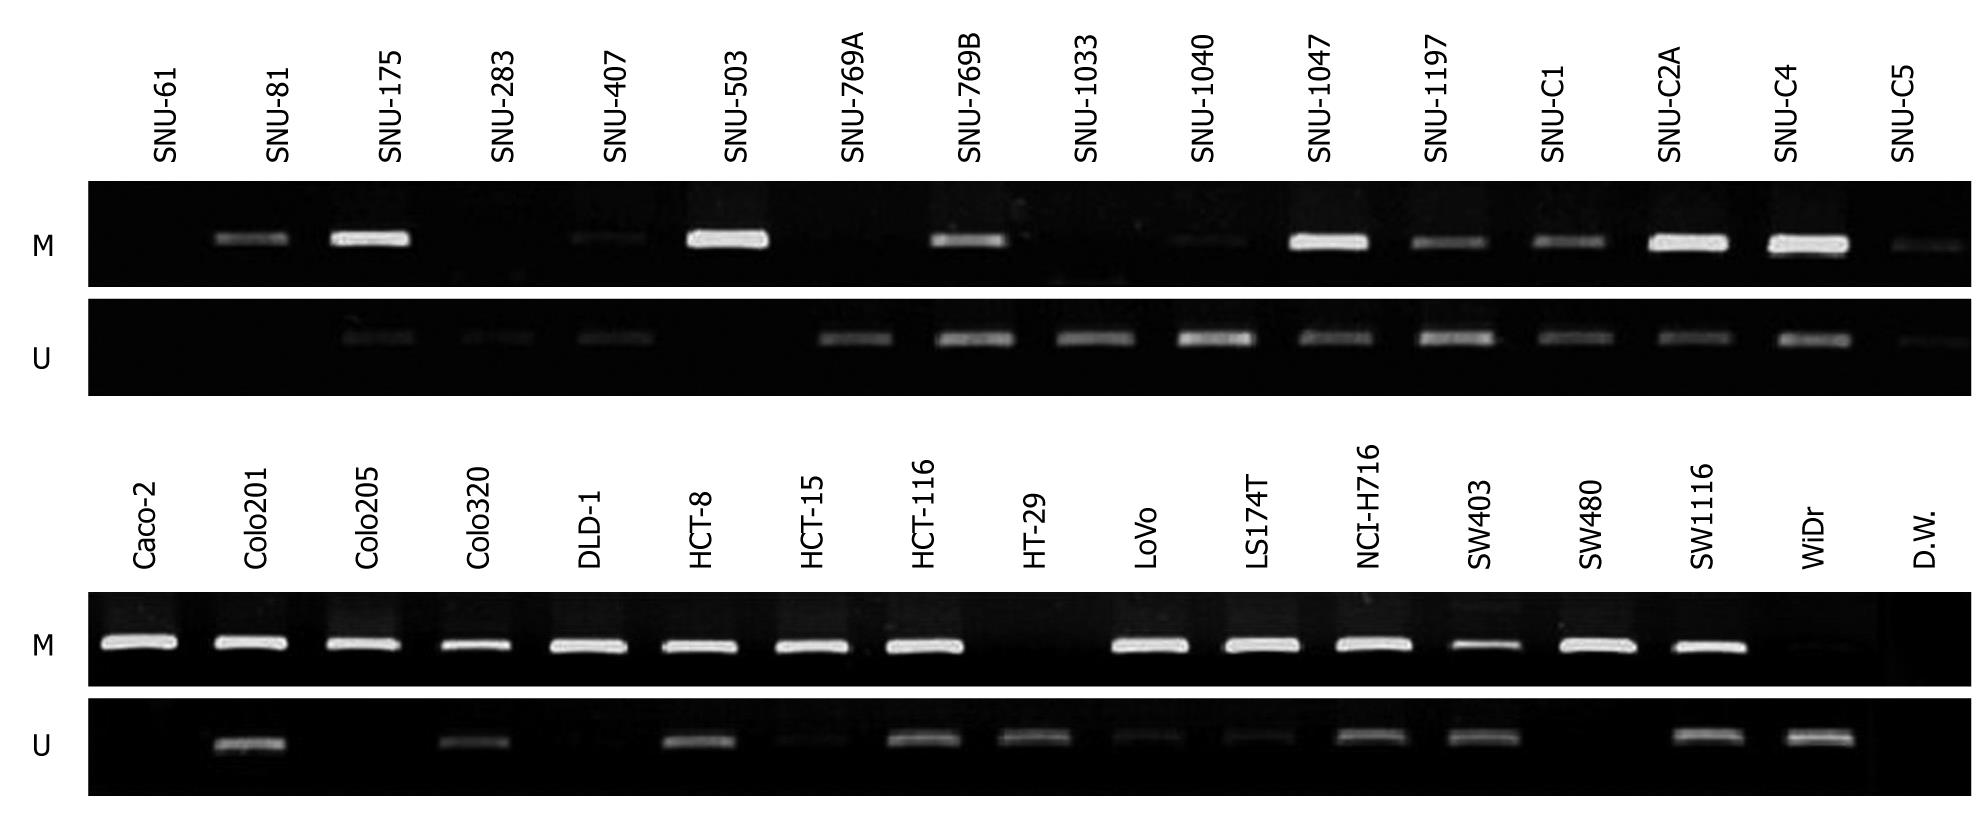
Figure 3 Methylation analysis of CD133 gene in 32 colorectal cancer cell lines by methylation specific-PCR (MS-PCR).
Lanes M and U denote that the product amplified by primer recognizing a methylated sequence and the product amplified by primer recognizing an unmethylated sequence, respectively.
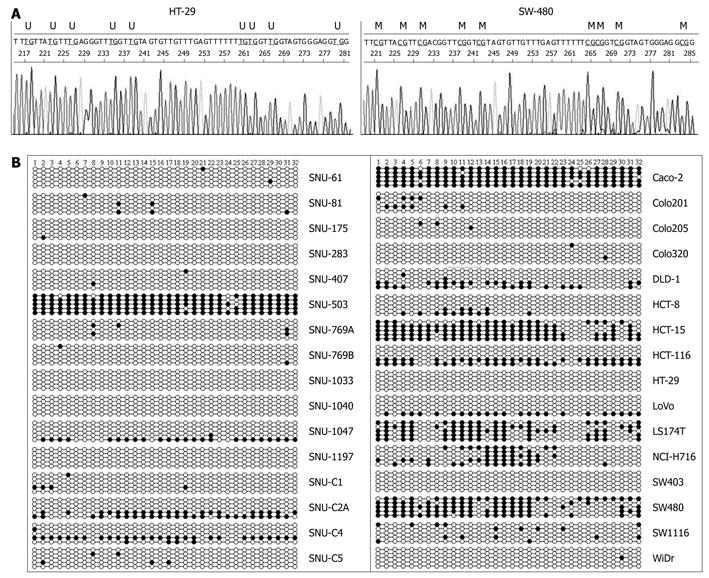
Figure 4 Analysis of methylation status of promoter CpG islands of CD133 by clonal sequencing.
A: Representative sequence diagrams of DNA sequencing analysis in (a) HT-29 (unmethylated) and (b) SW480 (methylated) cell lines. M: Methylated site; U: Unmethylated site; B: DNA sequencing analysis of 32 CpG dinucleotides. The numbers at the top show the CpG sites of amplified DNA by bisulfite sequencing primers. Circle represents CpG dinucleotides; closed circle: Methylation; open circle: Unmethylation.
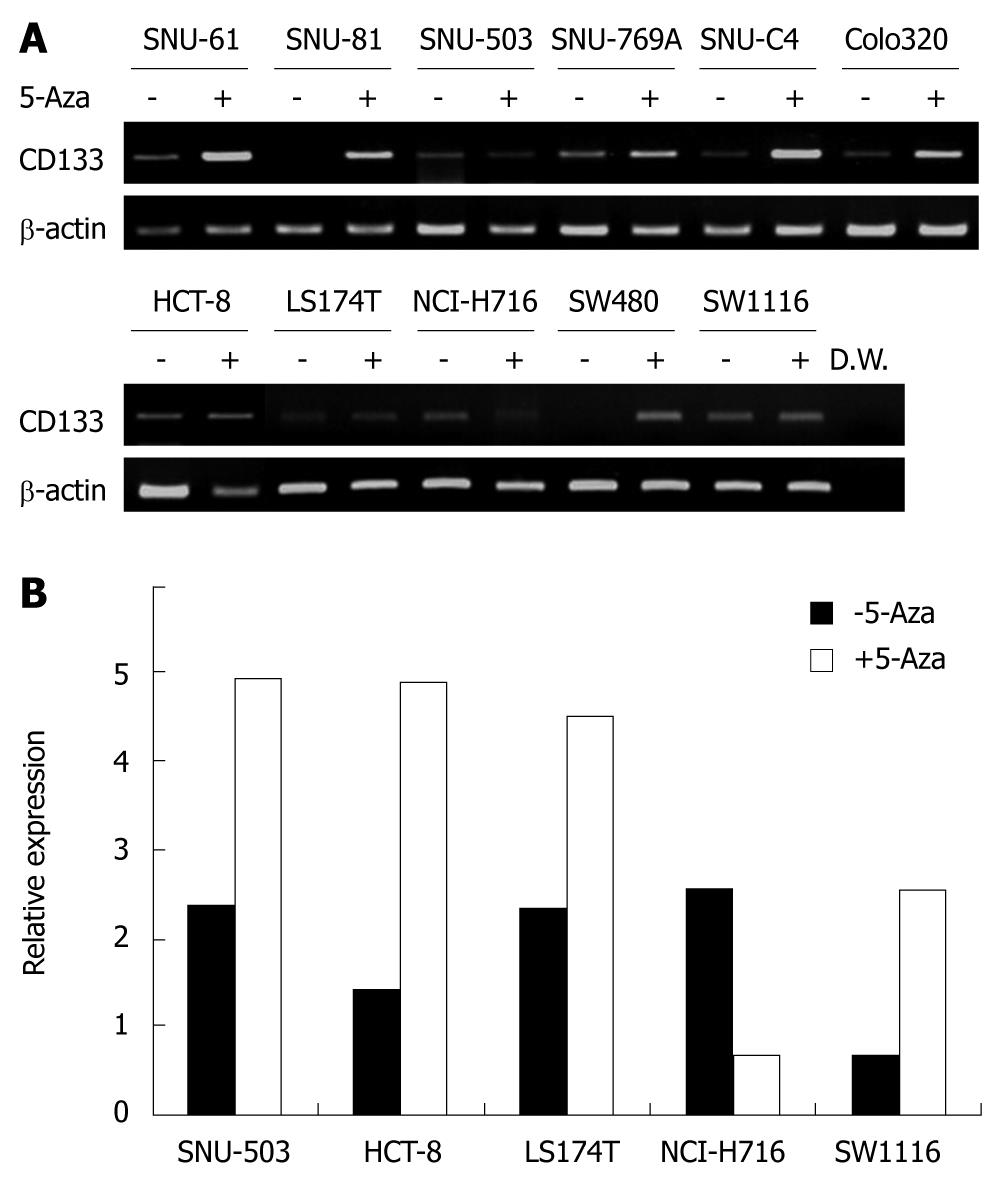
Figure 5 Expression analysis after treatment with 5-aza-2’-deoxycytidine (5-Aza).
A: RT-PCR analysis of CD133 expression in 11 cell lines with or without 5-aza-2’-deoxycytidine treatment; B: Representative results of real-time PCR analysis revealing CD133 expression in 5 cell lines with or without 5-aza-2’-deoxycytidine treatment.
-
Citation: Jeon YK, Kim SH, Choi SH, Kim KH, Yoo BC, Ku JL, Park JG. Promoter hypermethylation and loss of
CD133 gene expression in colorectal cancers. World J Gastroenterol 2010; 16(25): 3153-3160 - URL: https://www.wjgnet.com/1007-9327/full/v16/i25/3153.htm
- DOI: https://dx.doi.org/10.3748/wjg.v16.i25.3153


