Copyright
©2010 Baishideng.
World J Gastroenterol. Jan 14, 2010; 16(2): 210-216
Published online Jan 14, 2010. doi: 10.3748/wjg.v16.i2.210
Published online Jan 14, 2010. doi: 10.3748/wjg.v16.i2.210
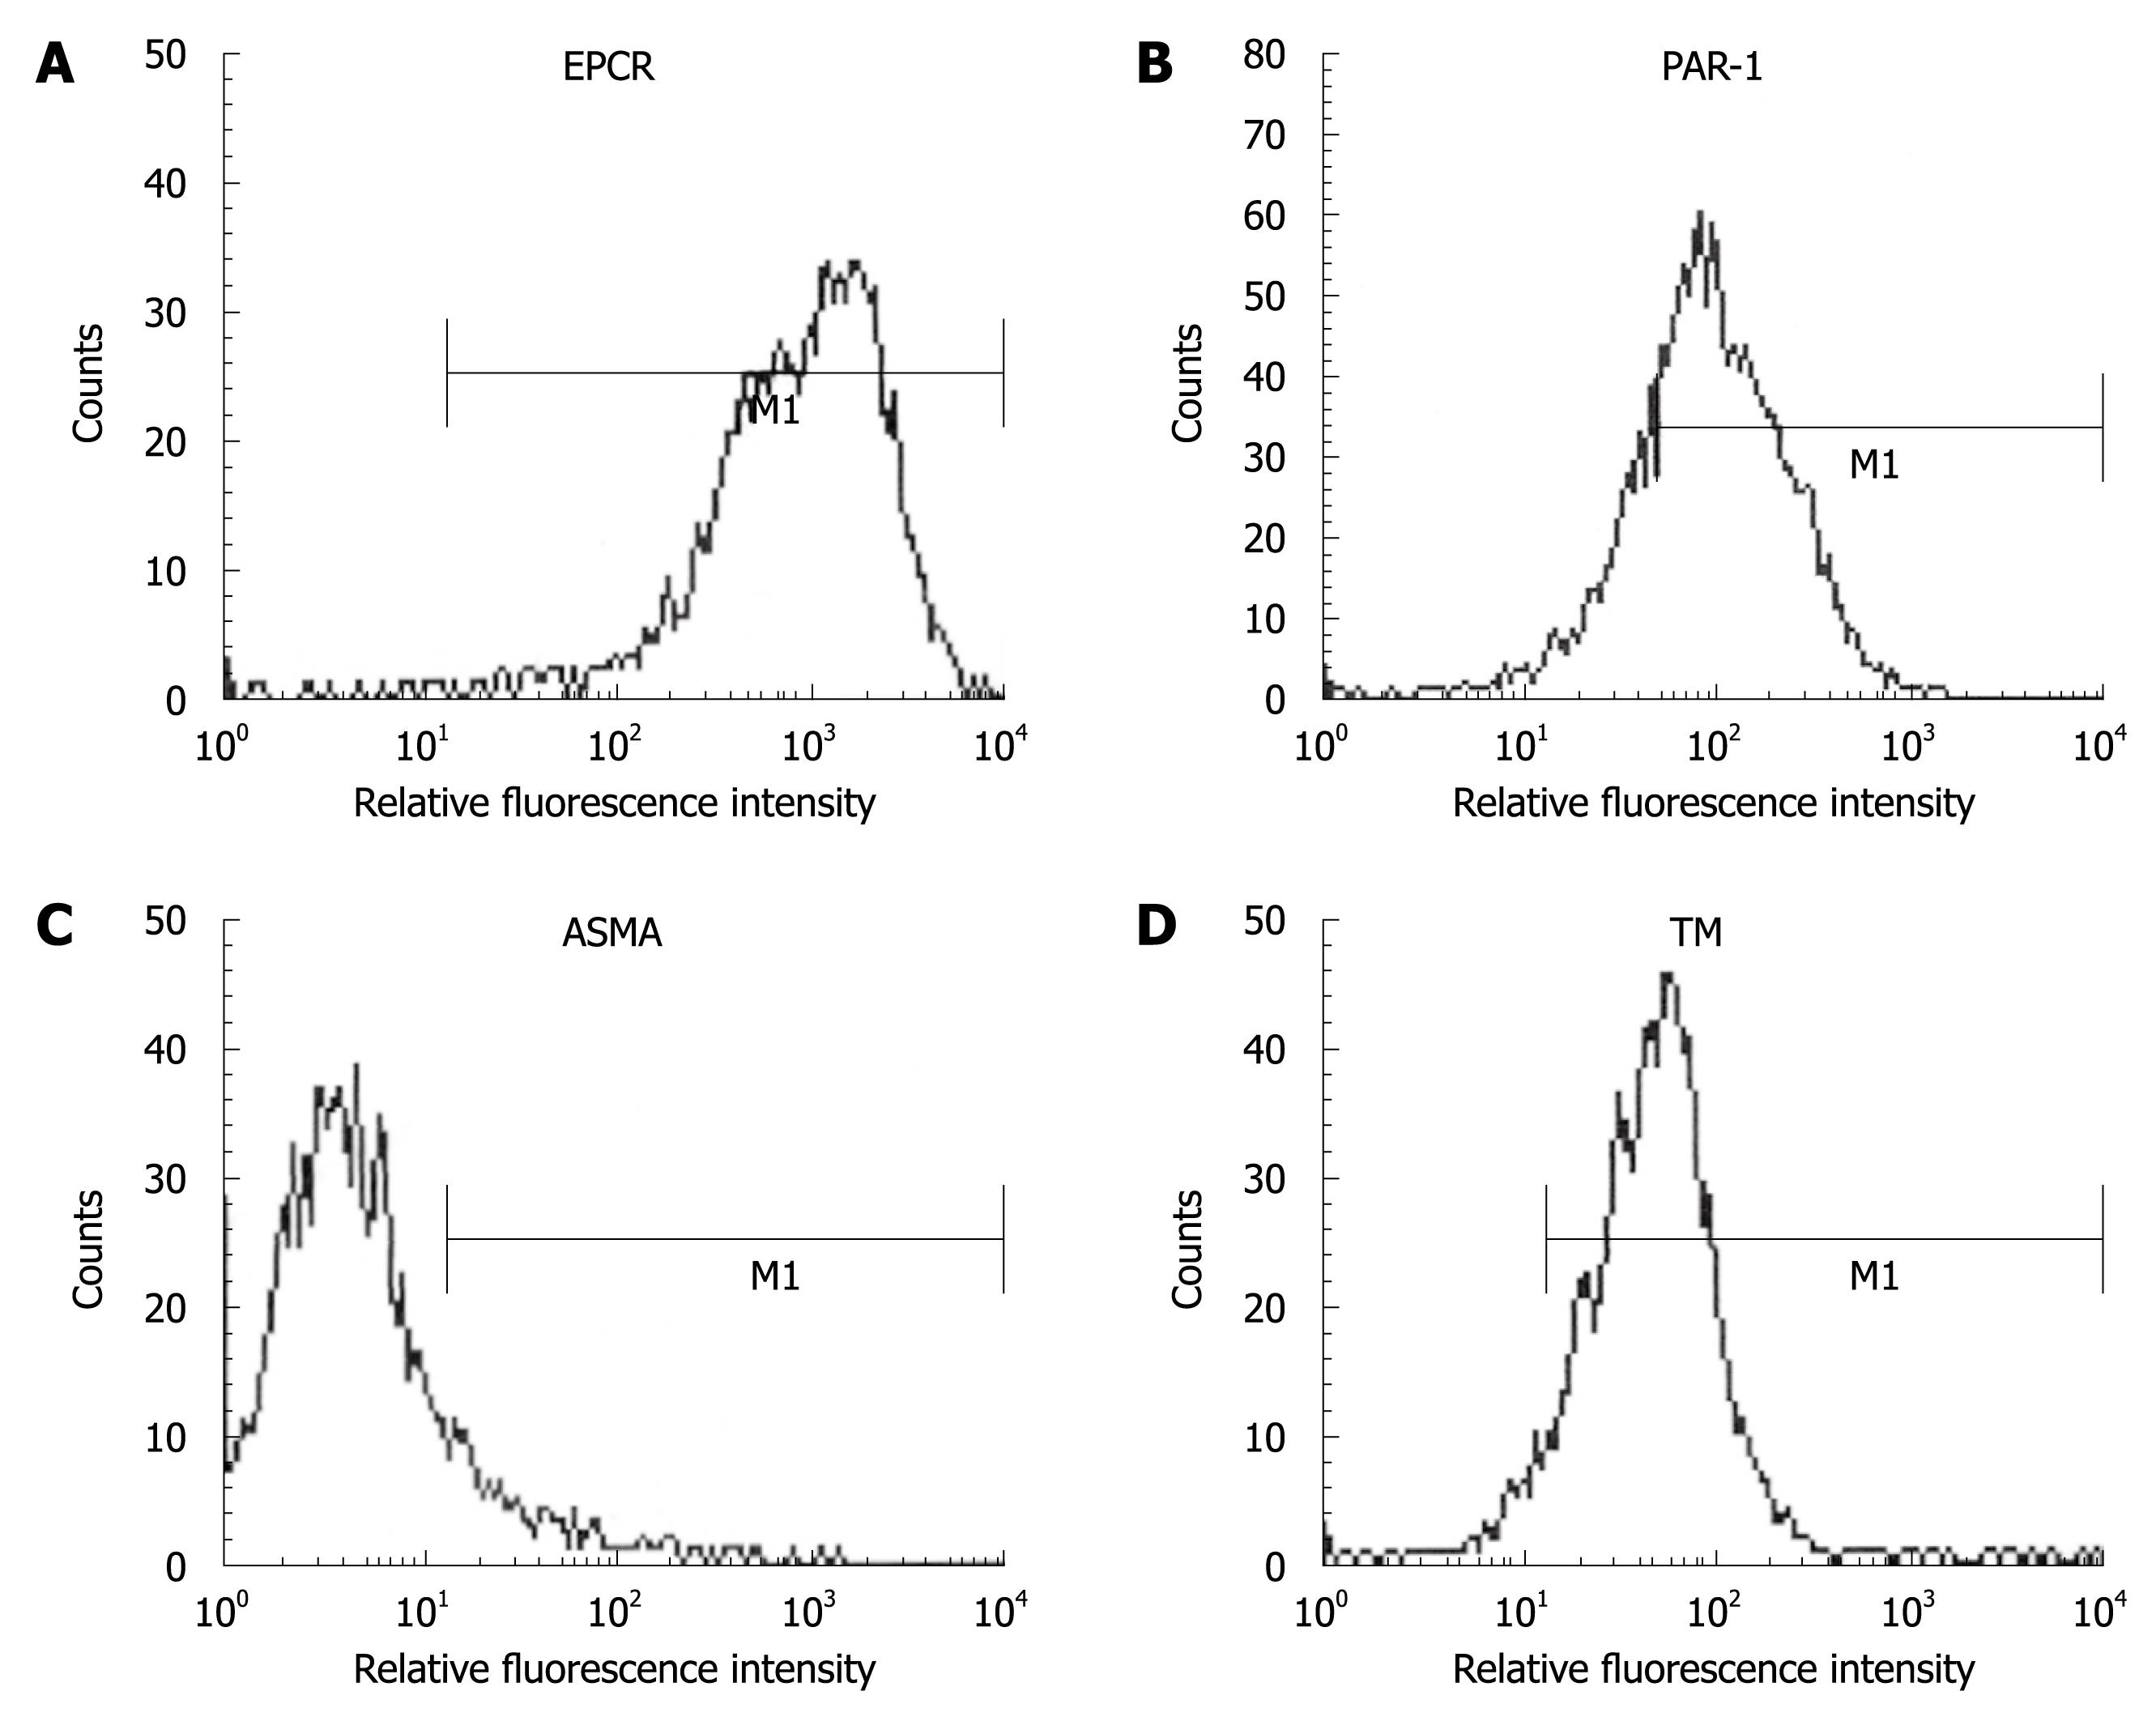
Figure 1 Human liver myofibroblasts express endothelial protein C receptor (EPCR) (A), protease activated receptor 1 (PAR-1) (B), anti-smooth muscle α-actin (ASMA) (C) and thrombomodulin (TM) (D).
Fixed unpermeabilized cells were labeled with antibodies to ASMA and thrombomodulin, and analyzed by flow cytometry. The signal obtained with a control antibody was superimposable with that of ASMA and was not shown for clarity.
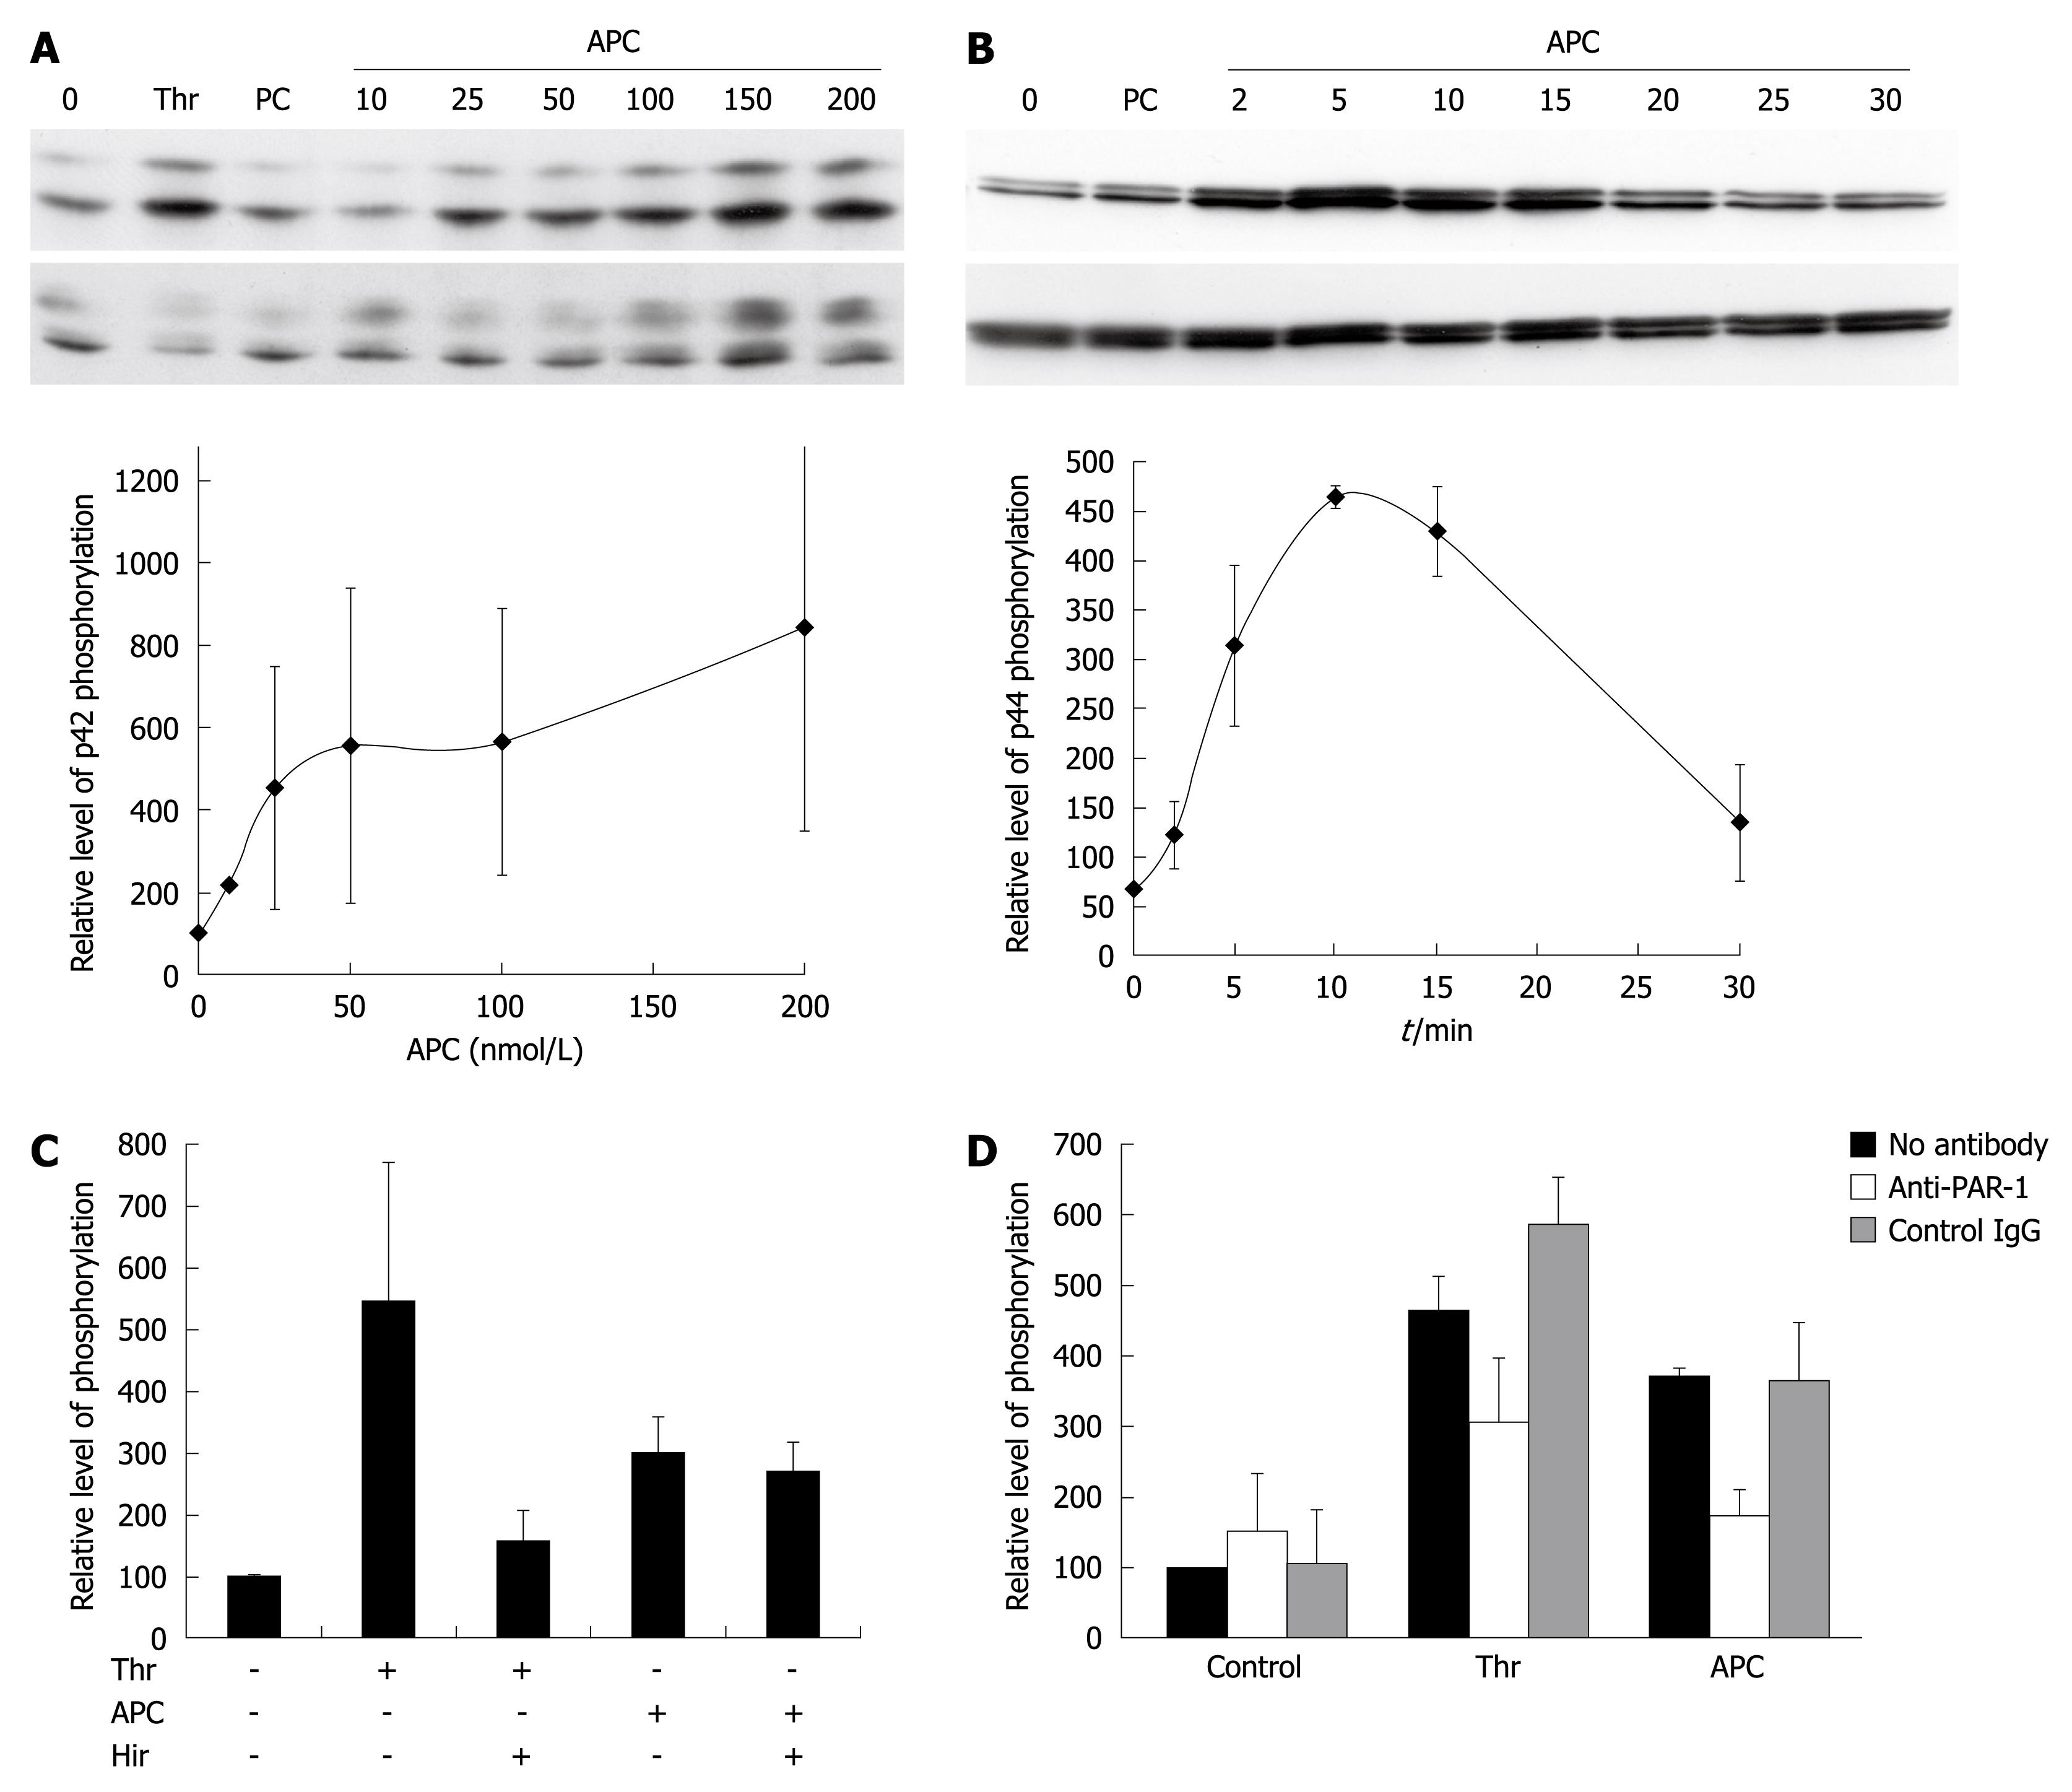
Figure 2 Effect of activated protein C (APC) on extracellular signal-regulated kinase (ERK) phosphorylation.
A: Dose-response of APC. Cells were exposed for 10 min to 27 nmol/L thrombin (Thr), 100 nmol/L nonactivated protein C (PC), or APC. ERK phosphorylation was assessed using Western blotting. The upper panel shows a blot labeled with an antibody to phospho-ERK, and the lower panel shows the same blot re-hybridized with an antibody to total ERK. The graph shows the quantification of p42 phosphorylation in three similar independent experiments. Results are shown as mean ± SE. Phospho-p42 signals were normalized first to total p42 signals, and the results were expressed as a percentage of the non-stimulated control. Similar results were obtained when quantitating p44 phosphorylation; B: Kinetics of APC induced phosphorylation of ERK. Cells were exposed to 100 nmol/L APC. The upper panel shows a blot labeled with an antibody to phospho-ERK, and the lower panel shows the same blot re-hybridized with an antibody to total ERK. The graph shows the quantification of p44 phosphorylation in three similar independent experiments. Phospho-p44 signals were normalized first to total p44 signals, and the results were expressed as a percentage of the non-stimulated control. Similar results were obtained when quantitating p42 phosphorylation; C: APC effect is not due to contaminating thrombin. Cells were exposed for 10 min to 27 nmol/L Thr or 100 nmol/L APC. They were pretreated with or without hirudin. The graph shows the quantification of combined ERK1/ERK2 phosphorylation in four similar independent experiments; D: APC signals through PAR-1. Cells were exposed for 10 min to 27 nmol/L Thr or 100 nmol/L APC. They were preincubated with the indicated antibodies. The graph shows the quantification of combined ERK1/ERK2 phosphorylation in three similar independent experiments.
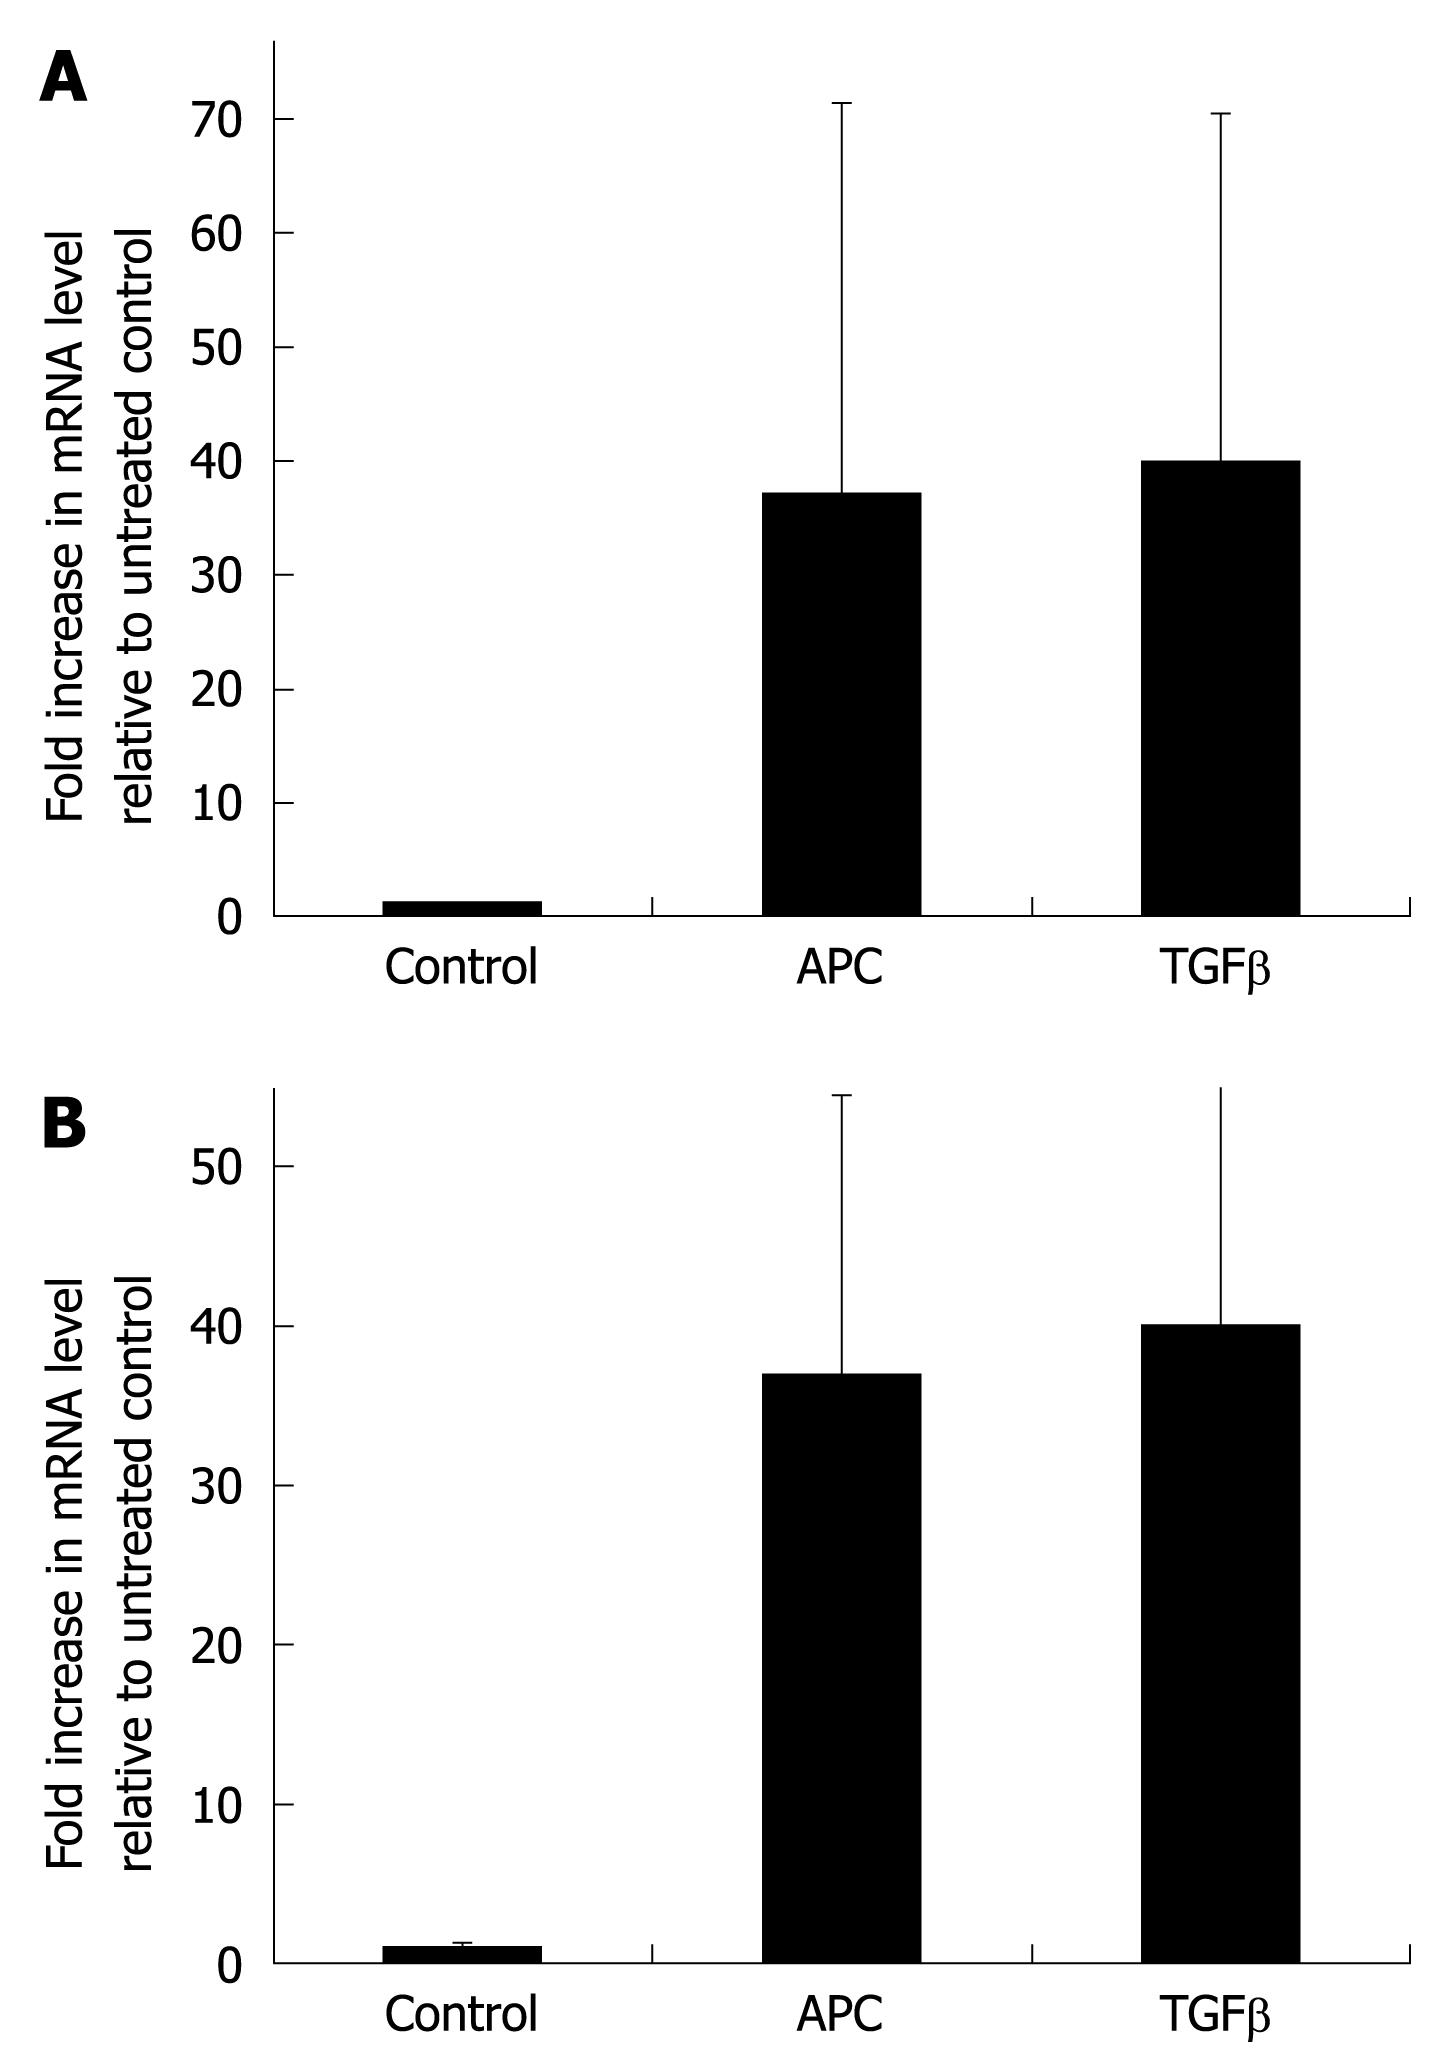
Figure 3 APC upregulates collagen transcripts.
A: Cells were exposed for 24 h to 100 nmol/L APC or 1 ng/mL transforming growth factor-β1. Collagen transcripts were measured by real-time reverse transcription-polymerase chain reaction and normalized to those of the RPL0 gene. Results are expressed as fold increase over control values and are the mean ± SE of five experiments; B: Cells were exposed for 6 h to 100 nmol/L APC, in the presence or absence of the mitogen-activated protein kinase (MAPK) inhibitor PD98059 (50 μmol/L), before measuring collagen transcripts. Results are the mean ± SE of three experiments.
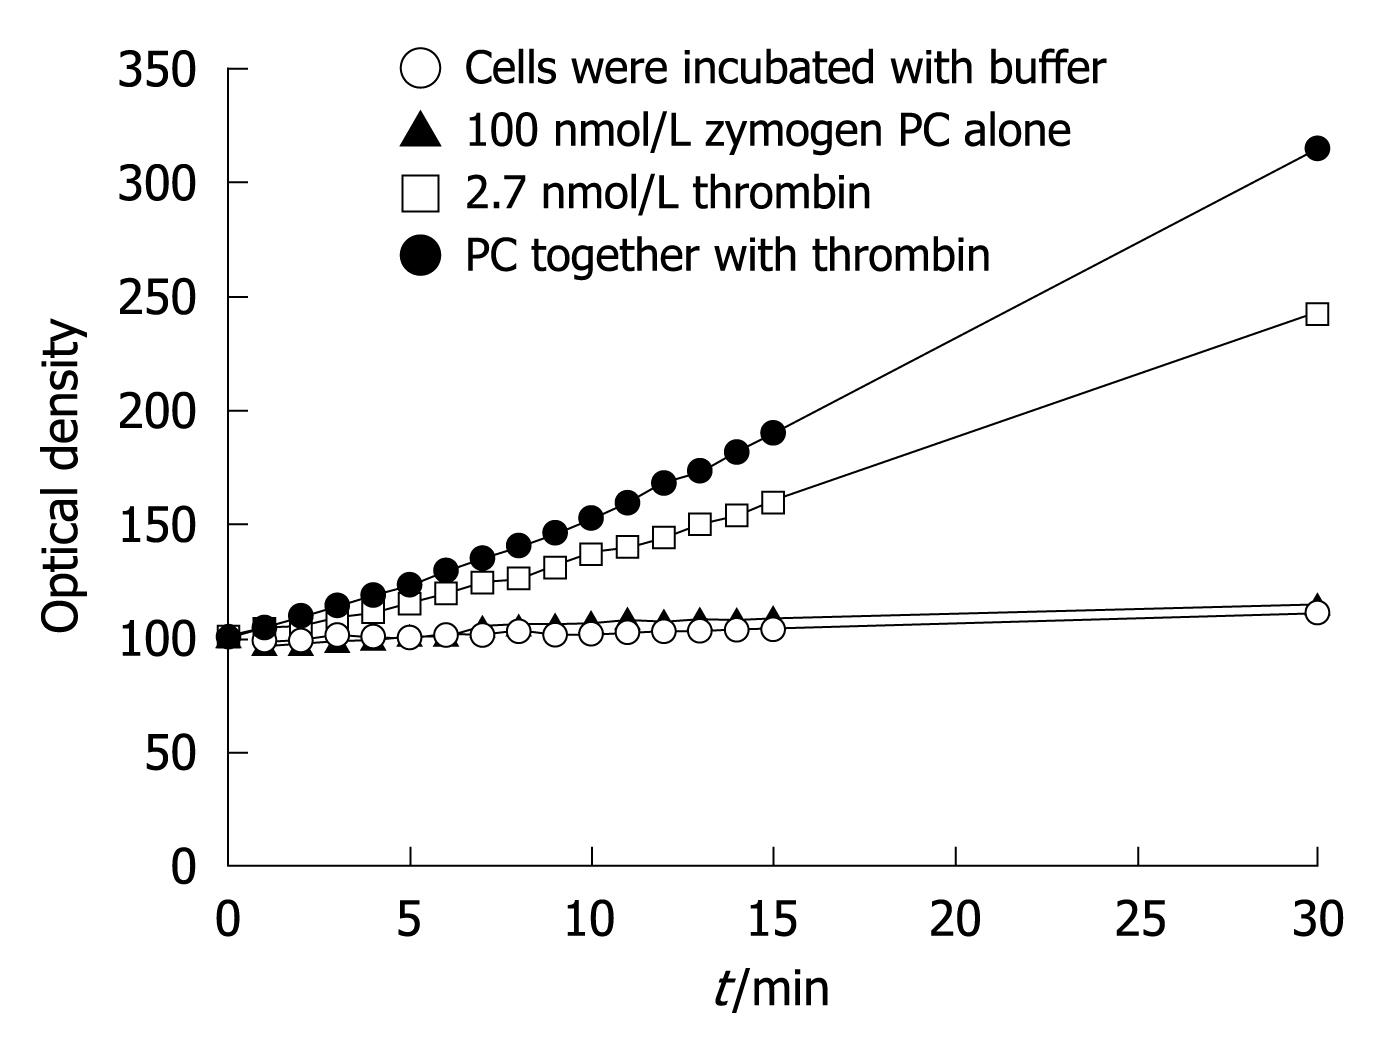
Figure 4 Human liver myofibroblasts can generate APC from PC.
Supernatants were collected and incubated with an APC chromogenic substrate. The graph shows the optical density at 405 nmol/L, which resulted from cleavage of the substrate, which was proportional to the amount of APC generated. It represents the mean of two separate experiments.
- Citation: Gillibert-Duplantier J, Rullier A, Neaud V, Kisiel W, Rosenbaum J. Liver myofibroblasts activate protein C and respond to activated protein C. World J Gastroenterol 2010; 16(2): 210-216
- URL: https://www.wjgnet.com/1007-9327/full/v16/i2/210.htm
- DOI: https://dx.doi.org/10.3748/wjg.v16.i2.210


