Copyright
©2010 Baishideng.
World J Gastroenterol. May 14, 2010; 16(18): 2283-2290
Published online May 14, 2010. doi: 10.3748/wjg.v16.i18.2283
Published online May 14, 2010. doi: 10.3748/wjg.v16.i18.2283
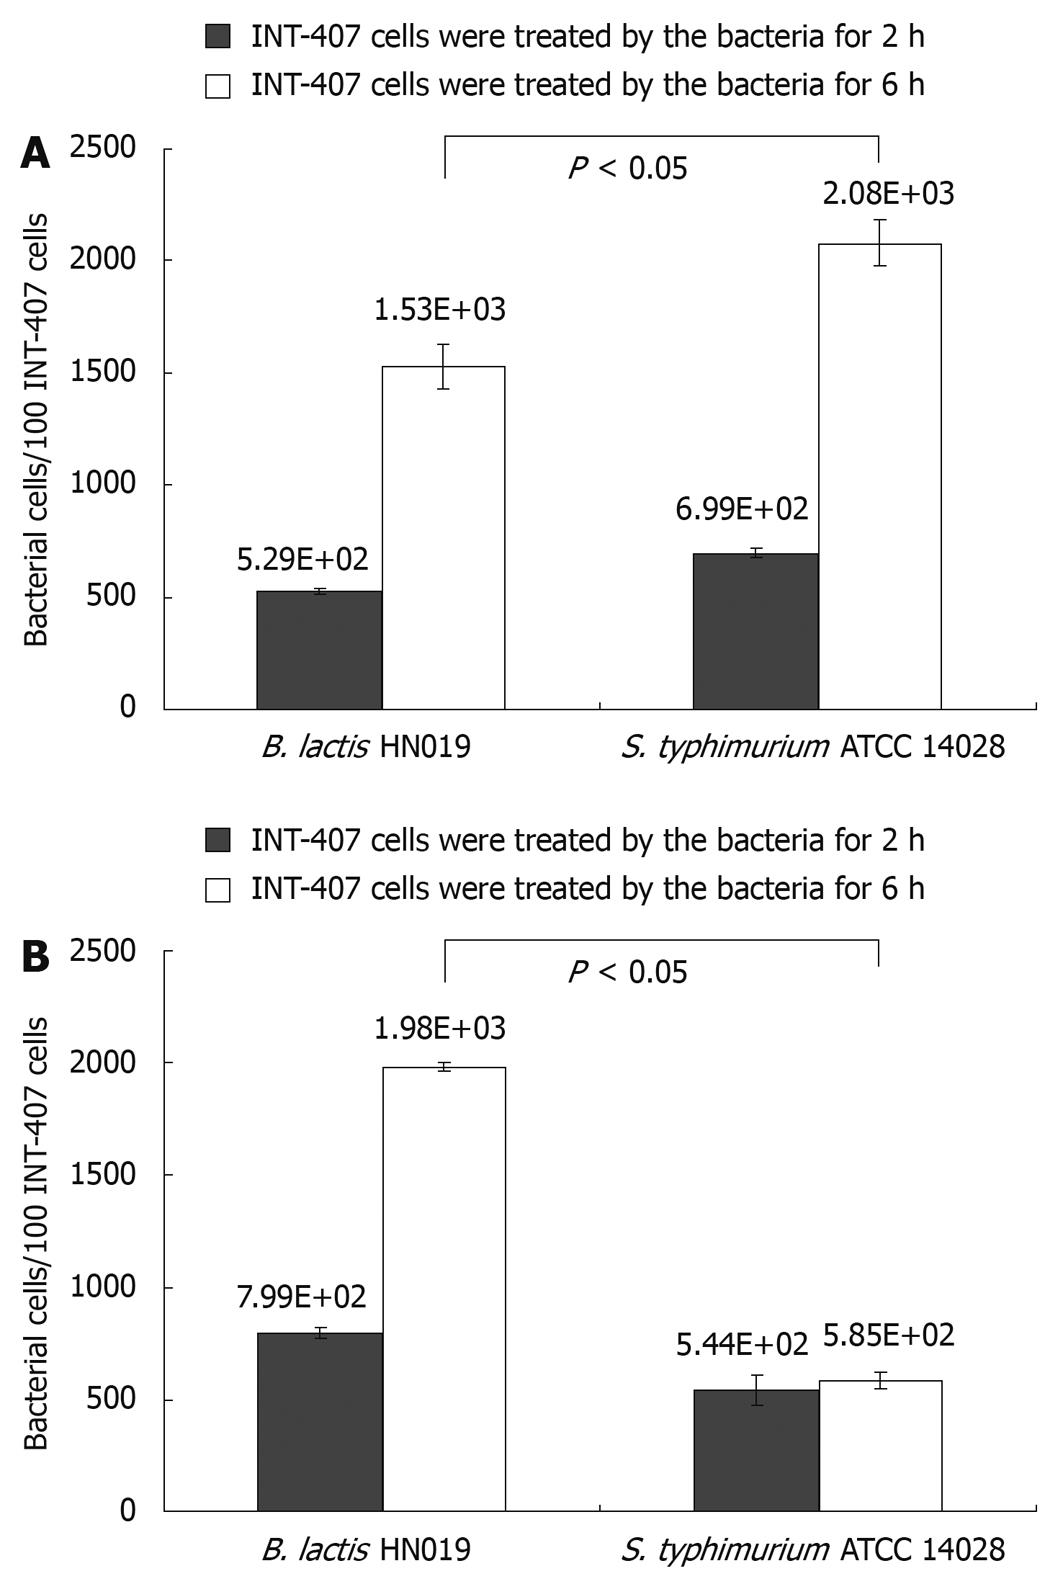
Figure 1 Adherence of Bifidobacterium lactis (B.
lactis) HN019 and Samonella typhimurium (S. typhimurium) ATCC 14028 to INT-407 cells. A: Number of bacteria bound to 100 INT-407 cells obtained in assays contain each single strain; B: Number of bacteria bound to 100 INT-407 cells obtained in assays contain S. typhimurium ATCC 14028 plus B. lactis HN019. The error bars represent ± SD of the mean values.
Figure 2 Transmission electron micrograph of INT-407 cells after stimulation with B.
lactis HN019 (arrows). A: Stimulation for 2 h (× 5800); B: Stimulation for 2 h (× 13 500); C: Stimulation for 6 h (× 5800); D: Stimulation for 6 h (× 13 500).
Figure 3 Effects of different bacterial treatment on expression of three genes assessed by real-time polymerase chain reaction.
IL: Interleukin; TNF: Tumor necrosis factor.
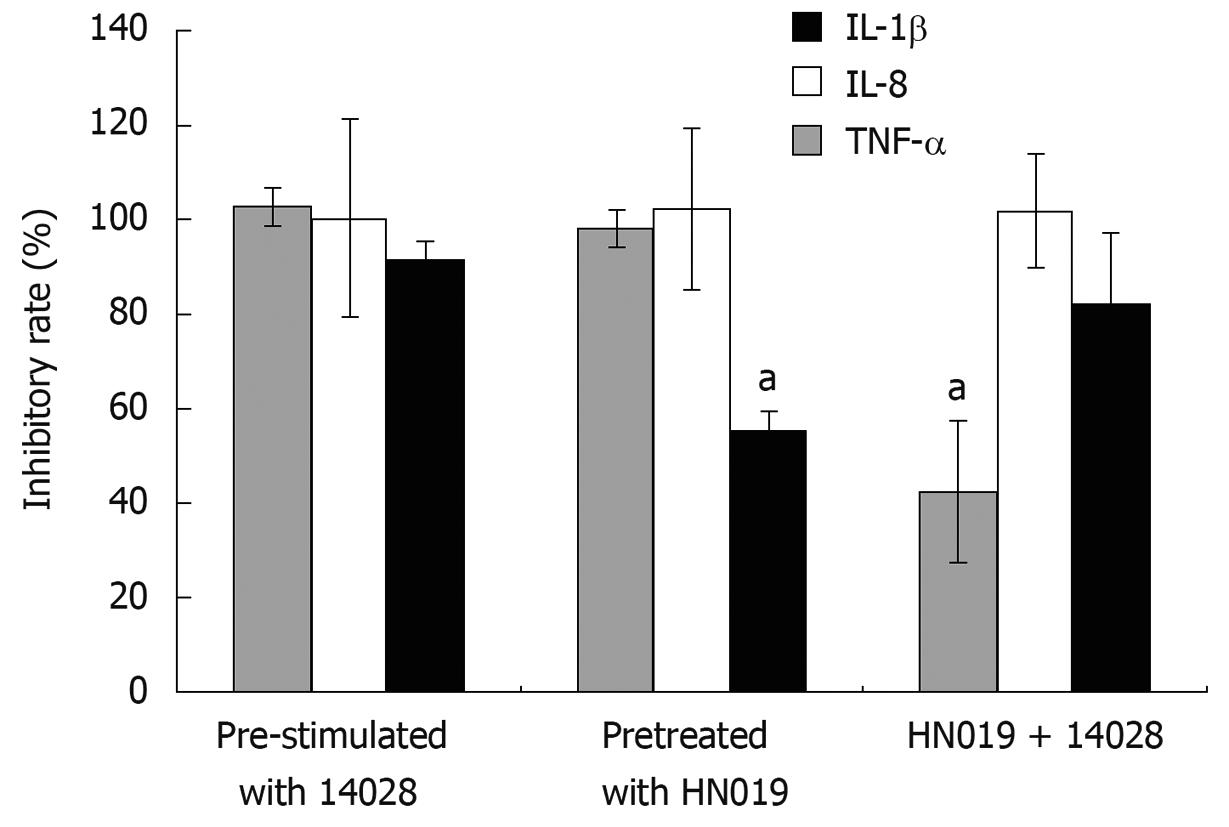
Figure 4 Inhibitory effects of B.
lactis HN019 on gene expression of pro-inflammatory cytokines. aP < 0.05 vs other treatment methods.
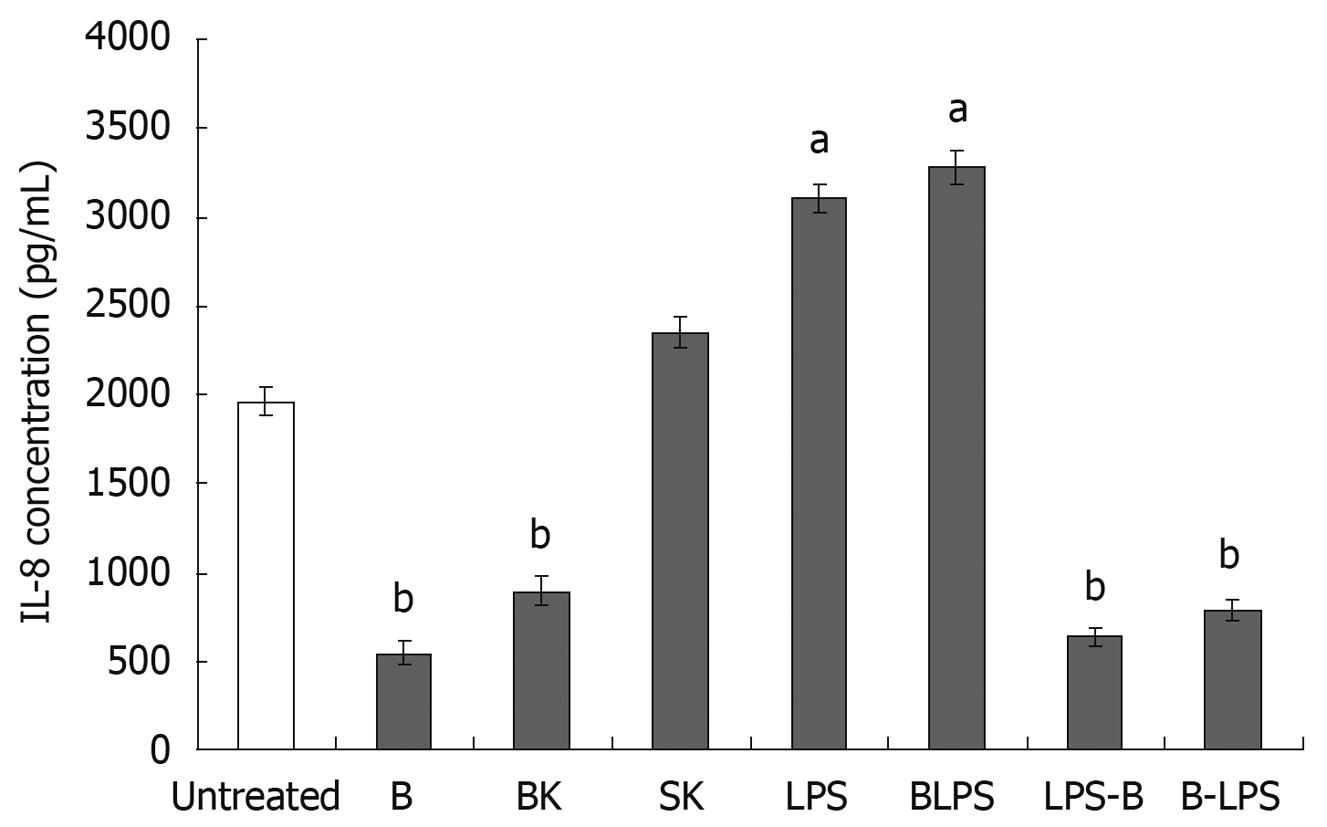
Figure 5 Bacteria modulate IL-8 secretion at baseline.
B: Bifidobacterium lactis HN019; BK: Heat-killed B. lactis HN019; SK: Heat-killed Salmonella typhimurium ATCC 14028; LPS: Lipopolysaccharide (10 ng/mL); BLPS: Co-incubation with B. lactis HN019 and LPS; LPS-B: Treated with B. lactis HN019 after pretreatment with LPS for 2 h; B-LPS: Treated with LPS after pretreatment with B. lactis HN019 for 2 h. The data are expressed as pg/mL and represent the mean ± SE. aP < 0.05, bP < 0.01 vs untreated monolayers.
-
Citation: Liu C, Zhang ZY, Dong K, Guo XK. Adhesion and immunomodulatory effects of
Bifidobacterium lactis HN019 on intestinal epithelial cells INT-407. World J Gastroenterol 2010; 16(18): 2283-2290 - URL: https://www.wjgnet.com/1007-9327/full/v16/i18/2283.htm
- DOI: https://dx.doi.org/10.3748/wjg.v16.i18.2283


