Copyright
©2010 Baishideng.
World J Gastroenterol. Apr 21, 2010; 16(15): 1845-1853
Published online Apr 21, 2010. doi: 10.3748/wjg.v16.i15.1845
Published online Apr 21, 2010. doi: 10.3748/wjg.v16.i15.1845
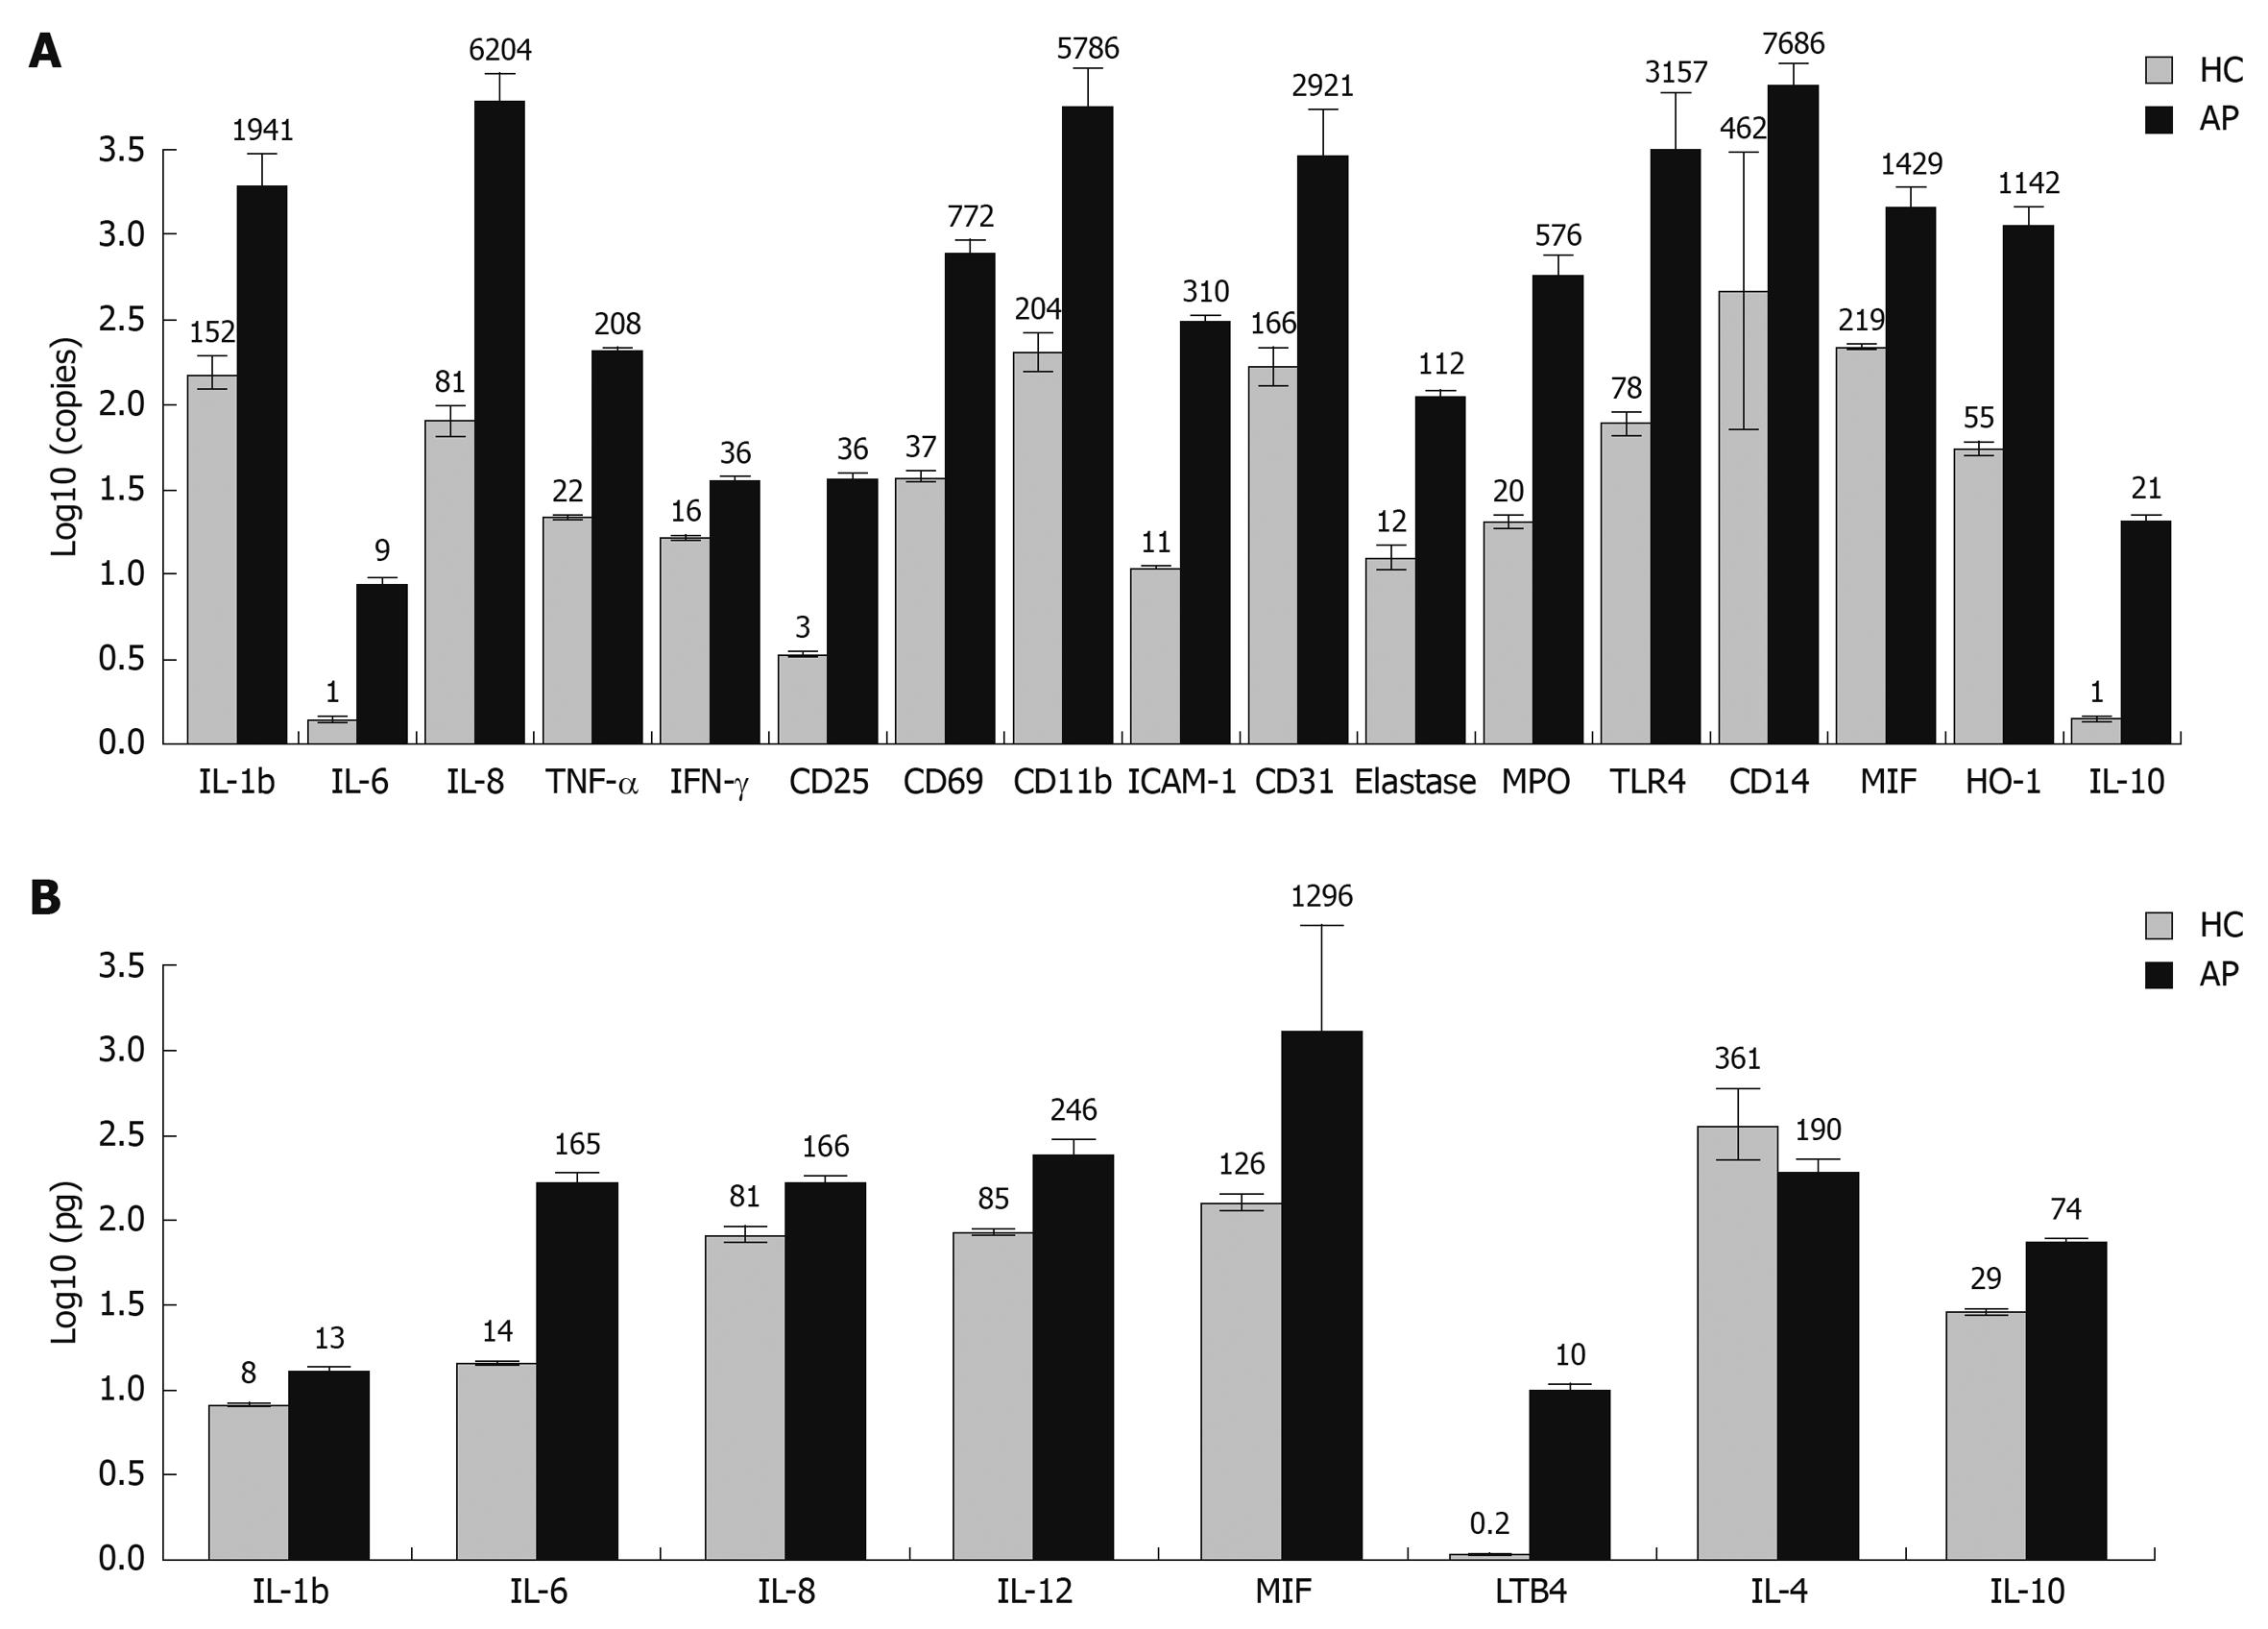
Figure 1 Cytokine expression at mRNA and protein level in peripheral blood of healthy subjects and acute pancreatitis (AP) patients.
A: Gene expression in peripheral blood leukocytes of healthy subjects and AP patients. Gene expression at mRNA level of 25 different cytokines, adhesion molecules, lymphocyte activation markers, and other biologically active substances known to be linked to the inflammatory response were assessed by quantitative real time polymerase chain reaction (QRT-PCR) in peripheral blood leukocytes of AP patients and healthy controls. A median 18-fold (range: 2-77) increase in mRNA expression of pro-inflammatory molecules was observed in the AP group in comparison to healthy control subjects (HC). Activation of the anti-inflammatory system and some cytoprotective molecules was also notable in the AP patient group. Cytokine mRNA expression levels with statistically significant differences between AP and healthy control groups are shown; B: Cytokine concentration in blood serum of healthy controls and AP patients. Expression of eight different soluble molecules at protein level was assessed in serum of AP patients and healthy subjects using the enzyme linked immunosorbent assay (ELISA) method. A median 3-fold (range: 2-59) increase in protein expression of pro-inflammatory molecules was observed in the AP group when compared to HC. Cytokine expression levels with statistically significant differences between AP and healthy control groups are shown. IL: Interleukin; TNF-α: Tumor necrosis factor-α; IFN-γ: Interferon-γ; MPO: Myeloperoxidase; MIF: Macrophage migration inhibitory factor.
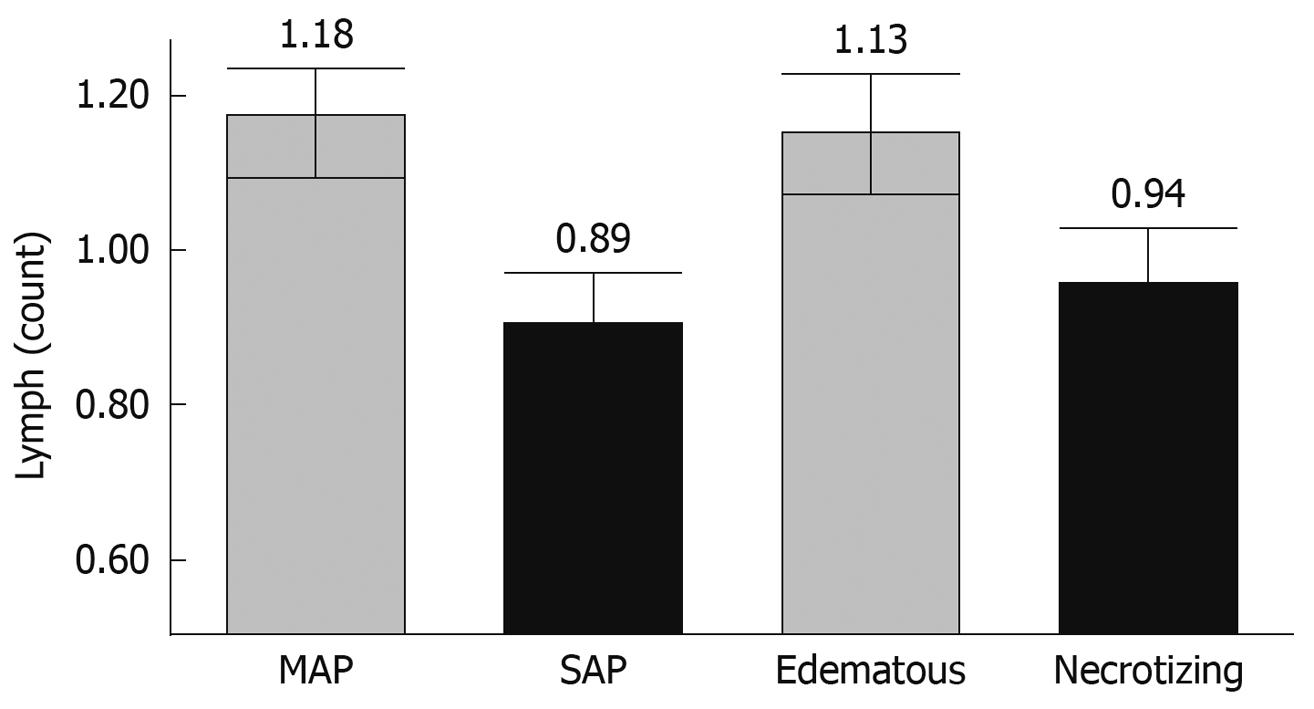
Figure 2 Reduction in number of lymphocytes during severe and necrotizing AP.
Number of circulating lymphocytes in peripheral blood was significantly reduced in severe acute pancreatitis (SAP) compared to mild AP groups (0.89 ± 0.08 × 10⁹/L vs 1.18 ± 0.07 × 10⁹/L, P < 0.05), and in necrotizing compared to edematous pancreatitis groups (0.94 ± 0.08 × 10⁹/L vs 1.13 ± 0.08 × 10⁹/L, P < 0.05). These findings demonstrate the presence of possible common molecular pathways leading to the development of severe and necrotizing AP.
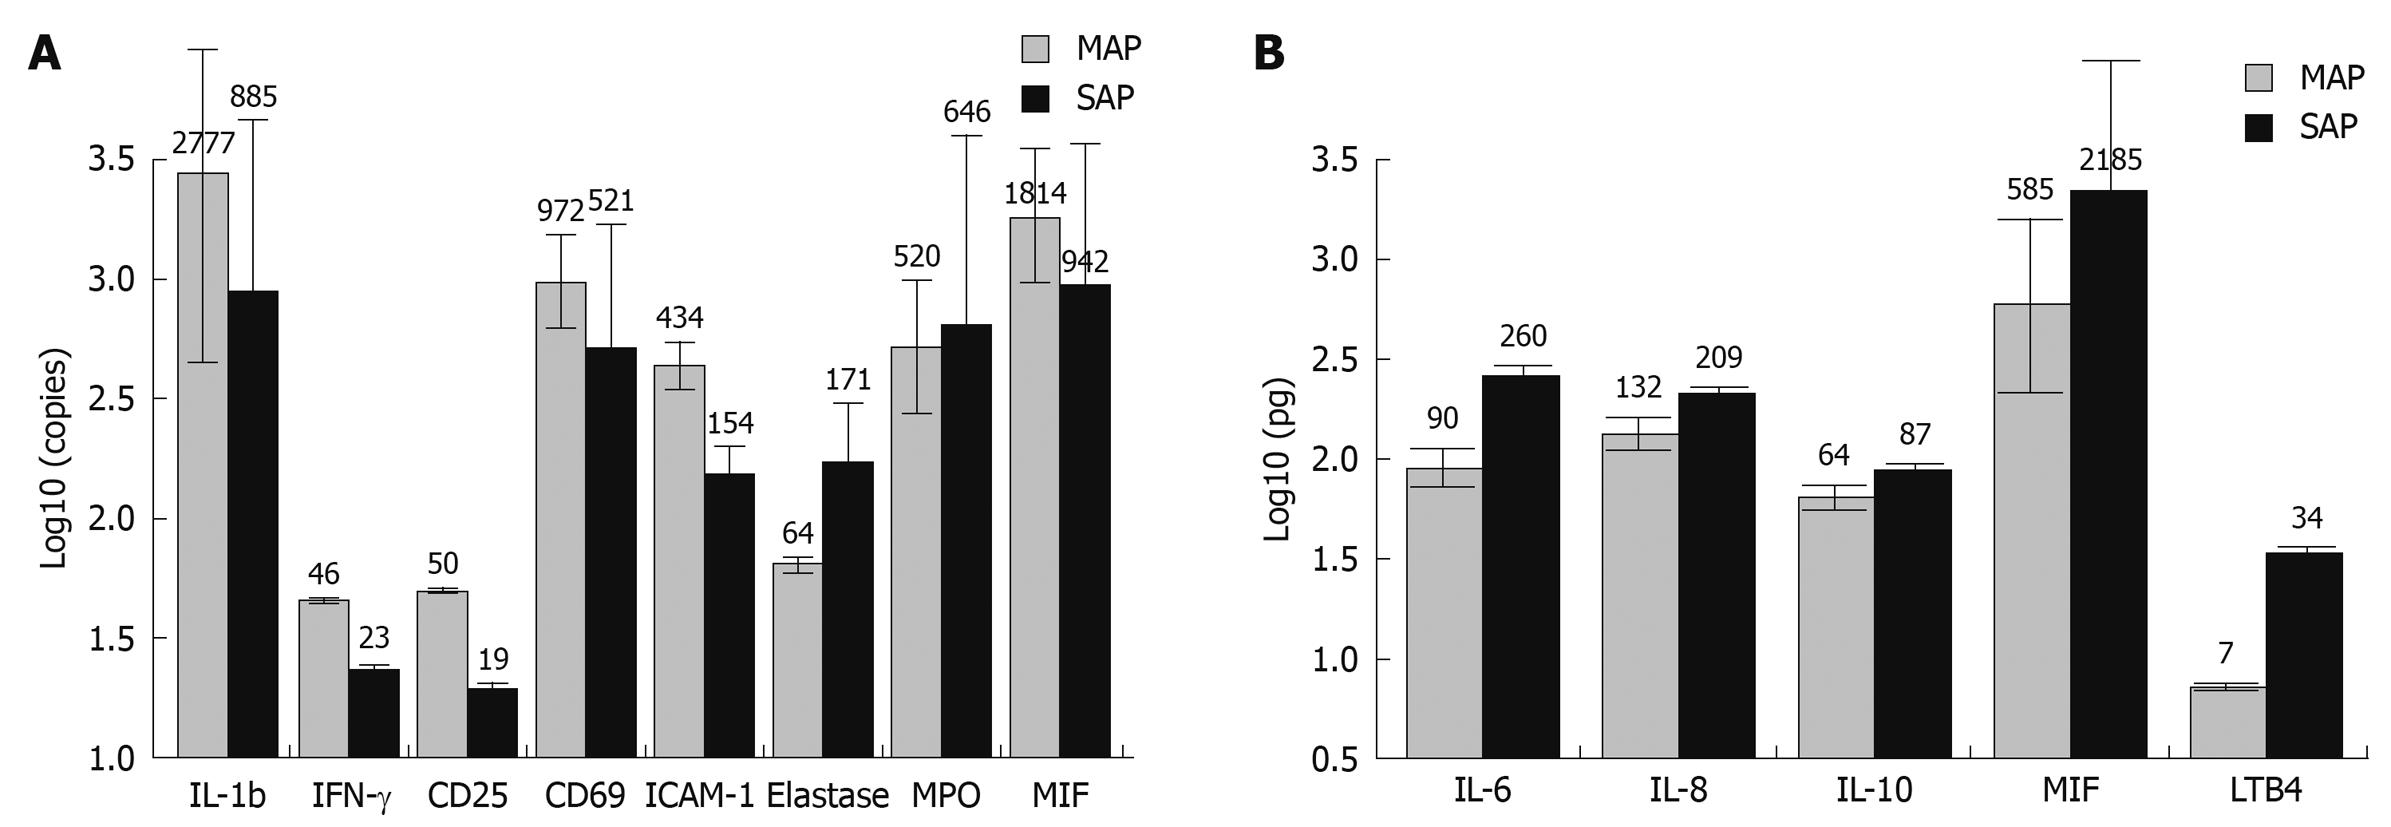
Figure 3 Cytokine expression at mRNA and protein level in peripheral blood of patients with mild and severe AP.
A: Gene expression in peripheral blood leukocytes of MAP and SAP patients. QRT-PCR analysis revealed that SAP is characterized by significantly decreased intracellular mRNA levels of interleukin (IL)-1 and interferon (IFN)-γ. SAP is also associated with markedly lower mRNA expression levels of CD25 and CD69 in peripheral blood leukocytes. However, severe and necrotizing pancreatitis was associated with a very high activation of neutrophils and macrophages as demonstrated by nearly ten-fold higher mRNA expression of elastase and myeloperoxidase in peripheral white blood cells (WBCs). A significantly lower mRNA expression of ICAM-1 and macrophage migration inhibitory factor (MIF) was observed in peripheral WBCs (but not in the blood serum) from patients with SAP compared to that of MAP group. Cytokine mRNA expression levels with statistically significant differences between MAP and SAP groups are depicted; B: Cytokine concentration in blood serum of MAP and SAP patients. Analysis of cytokine expression at protein levels shows that SAP is associated with a typical systemic inflammatory response syndrome (SIRS) and 2-5 fold increase in expression of pro-inflammatory cytokines (IL-6, IL-8, MIF). Induction of a compensatory and regulatory mechanism (IL-10) is also observed in this group. Up to 4-5 fold higher levels of LTB4 were recorded in patients who died during the early stages of the disease. Cytokine expression levels with statistically significant differences between AP and healthy control groups are shown.
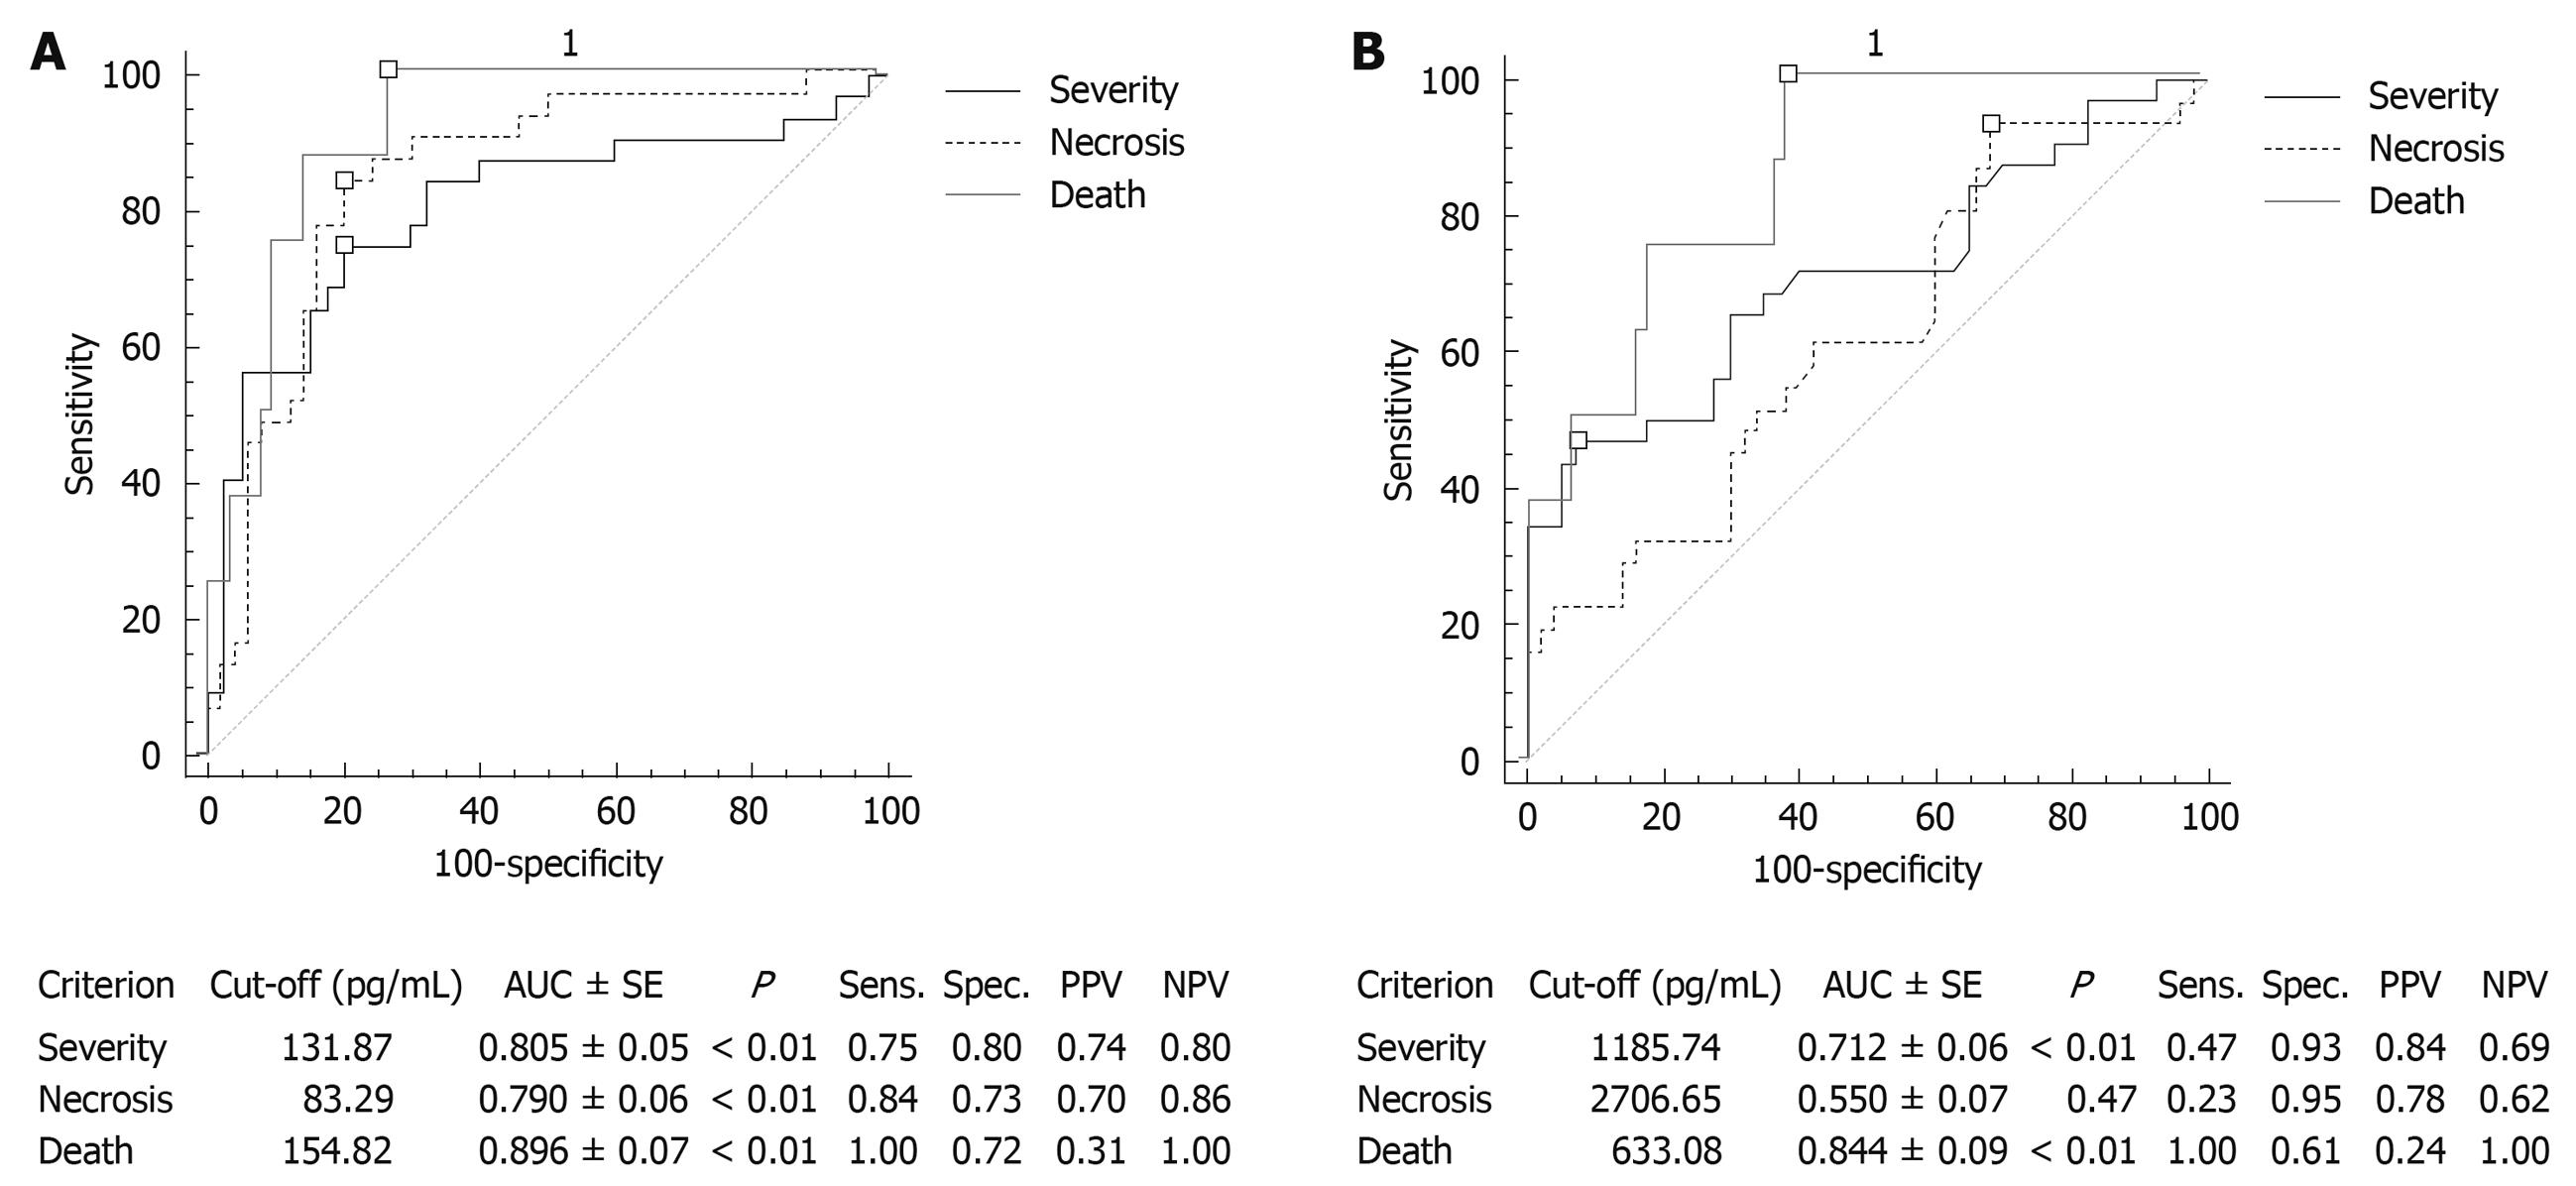
Figure 4 Prognostic utility of IL-6 and MIF in diagnosis of severe, necrotizing and fatal AP.
A: Performance of serum IL-6 in diagnosis of severe, necrotizing and fatal AP. The diagnostic performance of a test for discriminating severe, necrotizing and fatal cases of AP was evaluated using Receiver Operating Characteristic (ROC) curve analysis. Study revealed that serum IL-6 concentration is a good predictor of the severe disease and systemic complications (SIRS, MOF); this marker could also be utilized for the stratification of patients with necrotizing AP and those with possible fatal outcome; B: Performance of serum MIF in diagnosis of severe, necrotizing and fatal AP. The diagnostic performance of a test for discriminating severe, necrotizing and fatal cases of AP was evaluated using ROC curve analysis. Study revealed that serum MIF concentration is a good predictor of the severe disease and systemic complications (SIRS, MOF); this marker could be used for early identification of patients with possible fatal outcome. Comparison of ROC curves for IL-6 and MIF showed no statistically significant differences in this respect (P = 0.18 for severity; P = 0.58 for mortality). However, serum MIF concentration has very poor prognostic value in predicting the development of pancreatic necrosis and is inferior to IL-6 serum concentration in this respect (P < 0.01). AUC: Area under curve; Sens.: Sensitivity; Spec.: Specificity; PPV: Positive predictive value; NPV: Negative predictive value.
- Citation: Dambrauskas Z, Giese N, Gulbinas A, Giese T, Berberat PO, Pundzius J, Barauskas G, Friess H. Different profiles of cytokine expression during mild and severe acute pancreatitis. World J Gastroenterol 2010; 16(15): 1845-1853
- URL: https://www.wjgnet.com/1007-9327/full/v16/i15/1845.htm
- DOI: https://dx.doi.org/10.3748/wjg.v16.i15.1845


