Copyright
©2010 Baishideng.
World J Gastroenterol. Apr 7, 2010; 16(13): 1670-1672
Published online Apr 7, 2010. doi: 10.3748/wjg.v16.i13.1670
Published online Apr 7, 2010. doi: 10.3748/wjg.v16.i13.1670
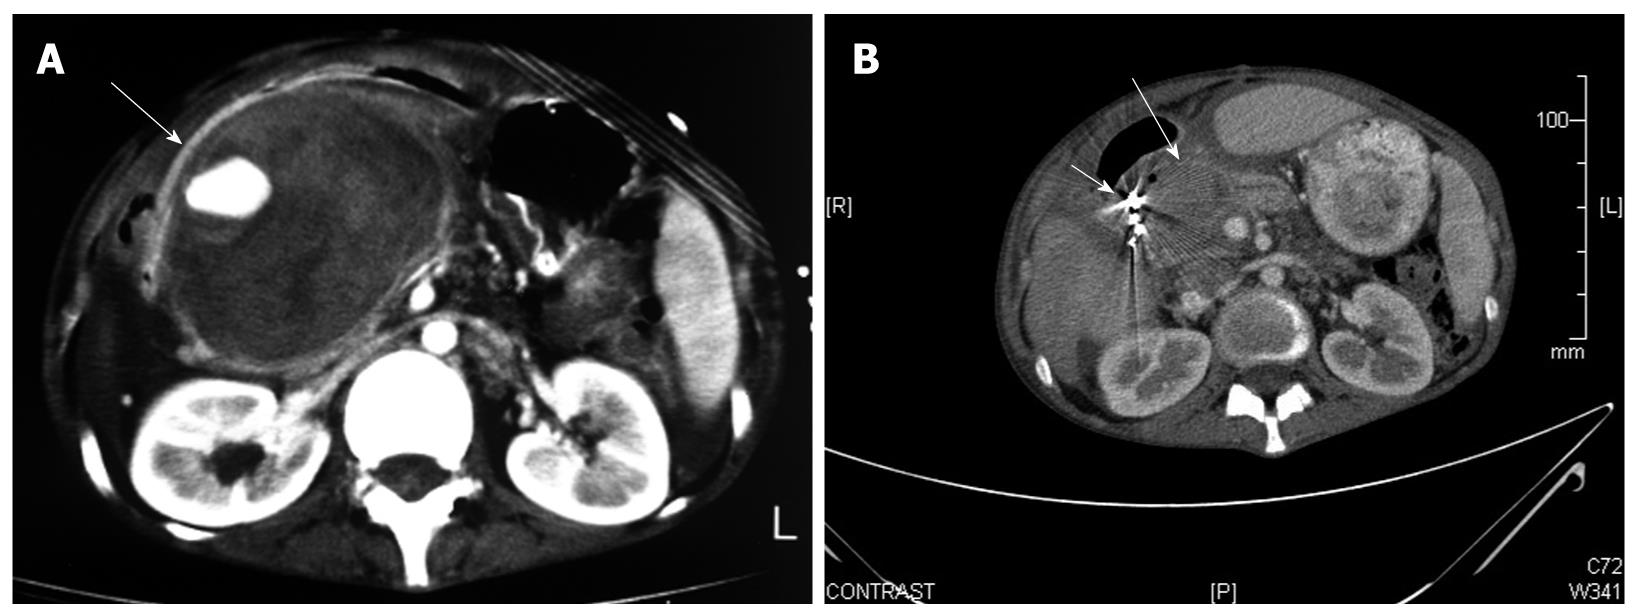
Figure 1 Computed tomography angiography (CTA).
A: CTA arterial late phase showing the giant GDA pseudoaneurysm (arrow); B: CTA eight days post the procedure which shows the reduction in size of the pseudoaneurysm (long arrow), angiographic coils (short arrow) and no perfusion.
- Citation: Elazary R, Abu-Gazala M, Schlager A, Shussman N, Rivkind AI, Bloom AI. Therapeutic angiography for giant bleeding gastro-duodenal artery pseudoaneurysm. World J Gastroenterol 2010; 16(13): 1670-1672
- URL: https://www.wjgnet.com/1007-9327/full/v16/i13/1670.htm
- DOI: https://dx.doi.org/10.3748/wjg.v16.i13.1670


