Copyright
©2010 Baishideng.
World J Gastroenterol. Apr 7, 2010; 16(13): 1622-1630
Published online Apr 7, 2010. doi: 10.3748/wjg.v16.i13.1622
Published online Apr 7, 2010. doi: 10.3748/wjg.v16.i13.1622
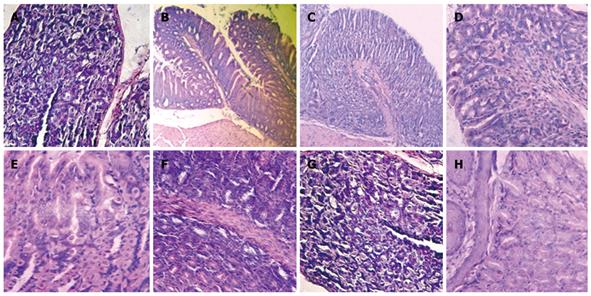
Figure 1 Histological micrographs of mice stomachs.
A: H (Healthy) group; B: G (Gastritis) group; C: FM 1190 group (fermented milk with Streptococcus thermophilus CRL 1190); D: OM (omeprazole) group; E: M (Milk) group; F: W (Water) group; G: M-EPS 1190 group (EPS produced by S. thermophilus CRL 1190 resuspended in milk) showed conserved histological structures; and H: W-EPS 1190 group (EPS produced by Strep. thermophilus CRL 1190 resuspended in water) displayed chronic inflammatory infiltrations in the mucosa surface (Hematoxylin & eosin, light microscope, × 100).
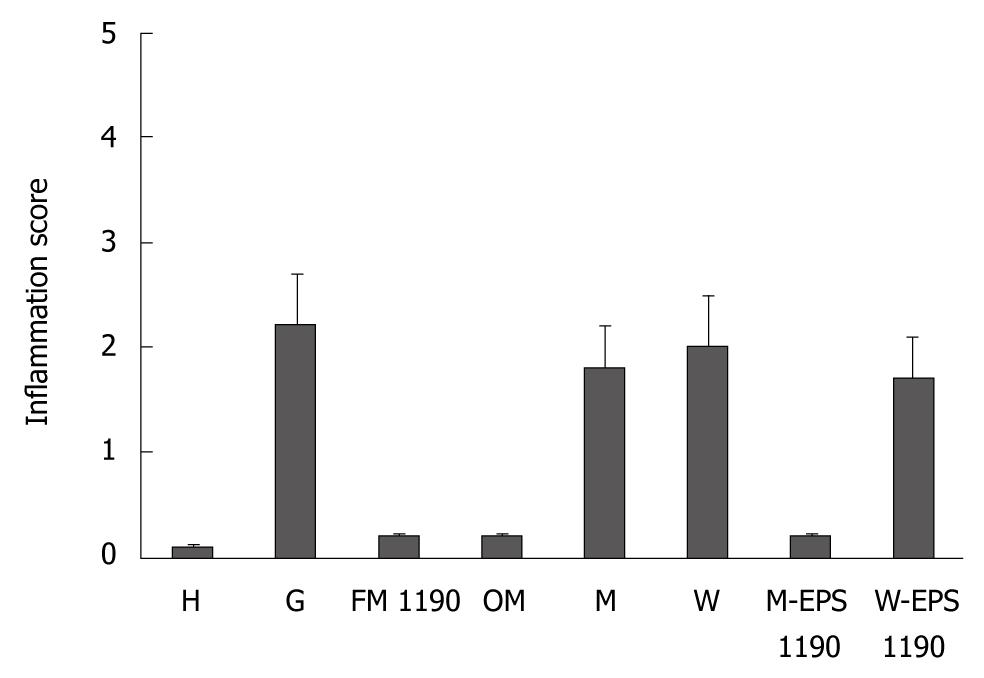
Figure 2 Inflammation score of stomachs in different groups (mean ± SD).
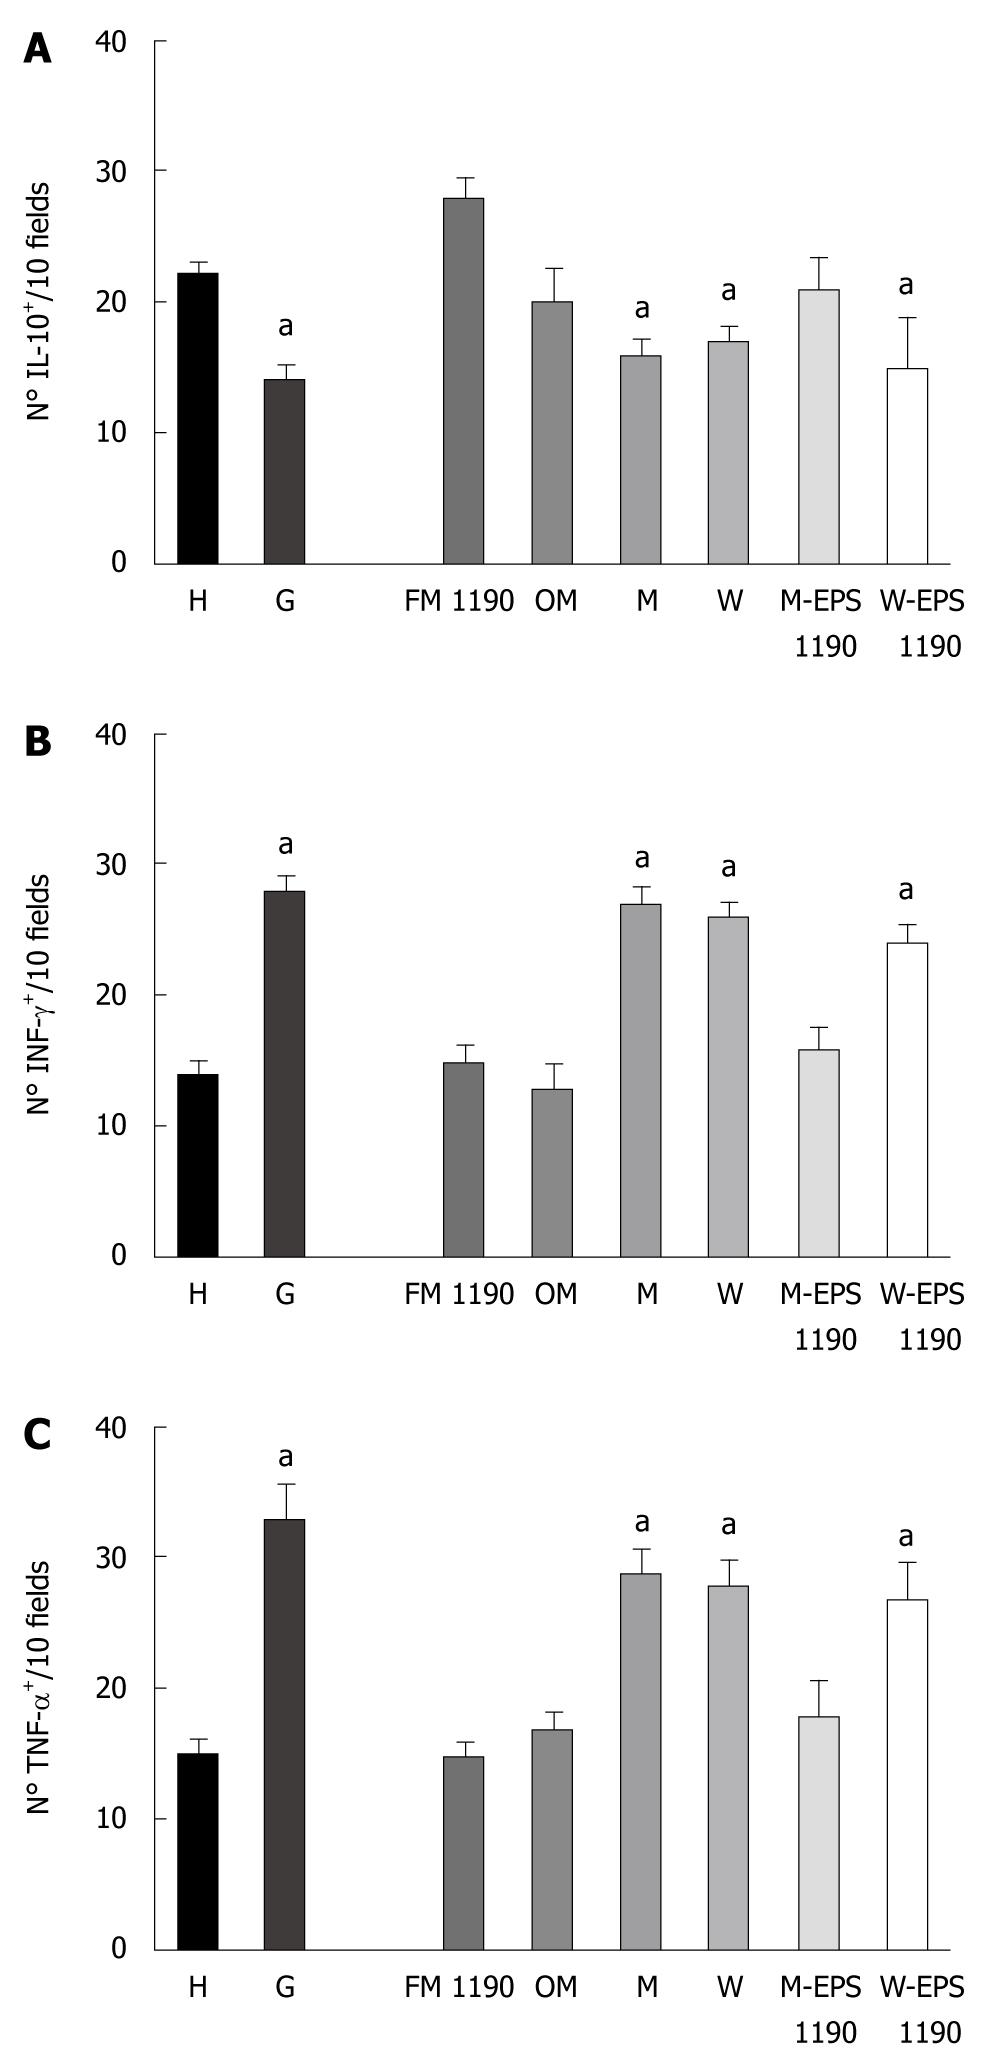
Figure 3 Number of (A) IL-10-, (B) INF-γ- and (C) TNF-α-producing cells on histological slices of stomachs of mice of different groups.
Results are presented as means of 3 determinations and are expressed as the number of IL-10-, INF-γ- and TNF-α-producing cells per 10 fields (magnification × 100). aP < 0.05 compared to the controls.
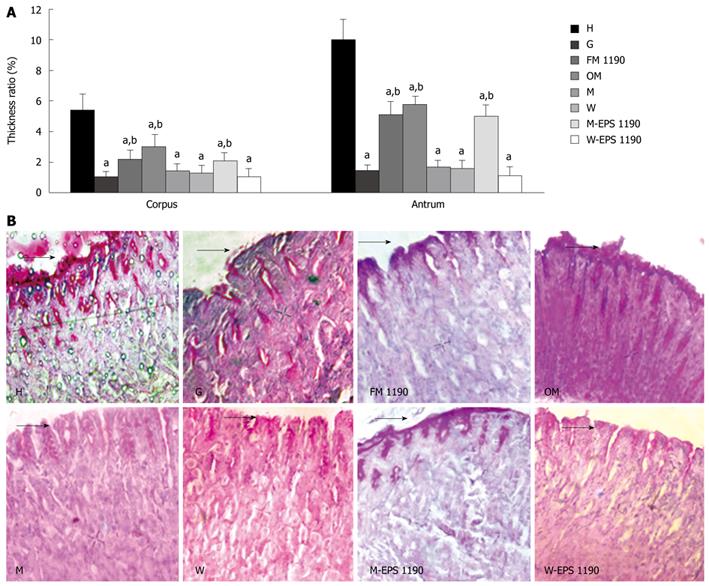
Figure 4 Periodic acid-Schiff (PAS)-positive mucus on the mice gastric mucosa.
A: Thickness ratio of the mucus gel layer to the lamina propria mucosa in corpus and antrum mucosa. B: Representative photomicrographs of corpus mucosa from the various groups. Sections were stained using PAS reagent. Values represent mean ± SE of the mean for 5 mice. aP < 0.05 compared to the healthy group (H), bP < 0.05 compared to the gastritis group (G). Original magnification: × 400. Arrows indicate thickness of mucus layer.
-
Citation: Rodríguez C, Medici M, Mozzi F, Valdez GF. Therapeutic effect of
Streptococcus thermophilus CRL 1190-fermented milk on chronic gastritis. World J Gastroenterol 2010; 16(13): 1622-1630 - URL: https://www.wjgnet.com/1007-9327/full/v16/i13/1622.htm
- DOI: https://dx.doi.org/10.3748/wjg.v16.i13.1622


