Copyright
©2010 Baishideng.
World J Gastroenterol. Apr 7, 2010; 16(13): 1577-1586
Published online Apr 7, 2010. doi: 10.3748/wjg.v16.i13.1577
Published online Apr 7, 2010. doi: 10.3748/wjg.v16.i13.1577
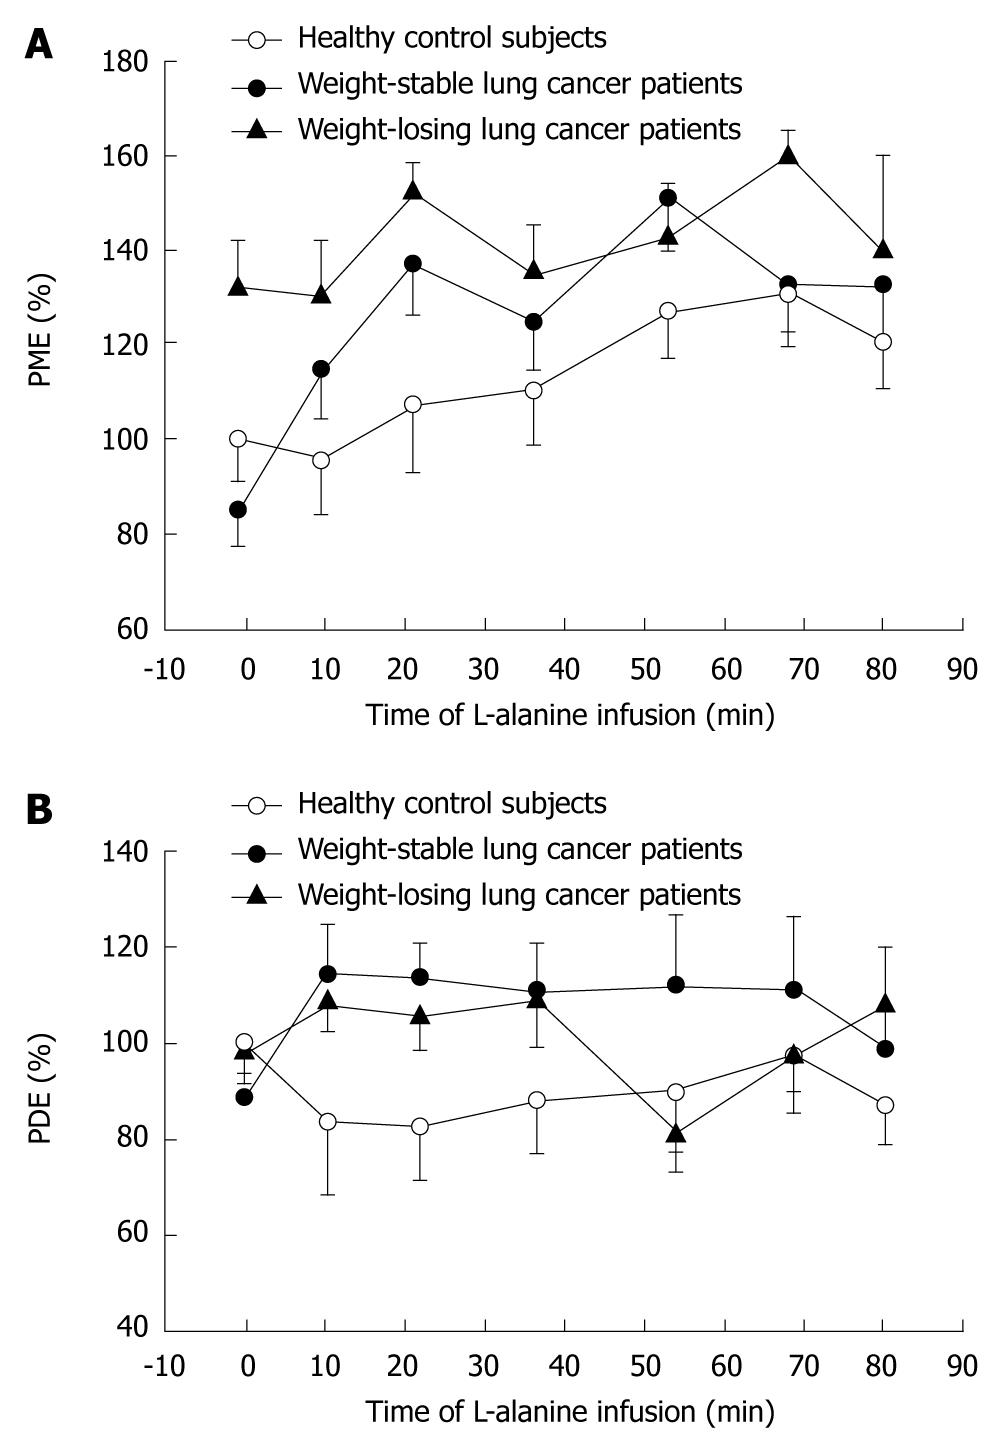
Figure 1 PME (A) and PDE (B) concentrations in the liver of healthy control subjects (n = 9) as well as weight-stable (n = 10) and weight-losing (n = 7) lung cancer patients during a primed-constant infusion of L-alanine (initial priming, 1.
4-2.8 mmol/kg; infusion, 2.8 mmol/kg per hour). Curves represent means; bars, SE. Values are expressed as percentage of mean baseline value of healthy subjects (100%). Times during L-alanine infusion are mid-time points of 31P MRS data collection referenced to the start of the L-alanine infusion (0 = baseline). From[50], with permission.
- Citation: Dagnelie PC, Leij-Halfwerk S. Magnetic resonance spectroscopy to study hepatic metabolism in diffuse liver diseases, diabetes and cancer. World J Gastroenterol 2010; 16(13): 1577-1586
- URL: https://www.wjgnet.com/1007-9327/full/v16/i13/1577.htm
- DOI: https://dx.doi.org/10.3748/wjg.v16.i13.1577


