Copyright
©2010 Baishideng.
World J Gastroenterol. Mar 28, 2010; 16(12): 1500-1505
Published online Mar 28, 2010. doi: 10.3748/wjg.v16.i12.1500
Published online Mar 28, 2010. doi: 10.3748/wjg.v16.i12.1500
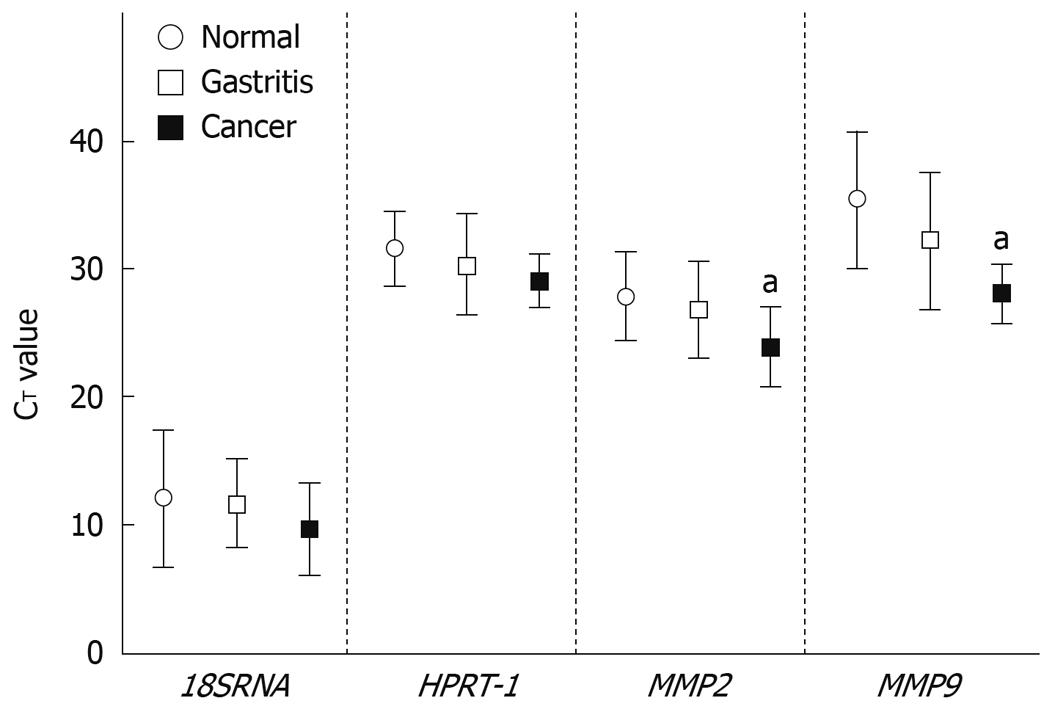
Figure 1 Relative mRNA expression of 18S ribosomal RNA (18SRNA), hypoxanthine ribosyltransferase-1 (HPRT-1), matrix metalloproteinases 2 (MMP2) and MMP9 in three different groups of gastric mucosa tissues.
Error bars represent the mean ± SD. aP < 0.05 vs normal condition.
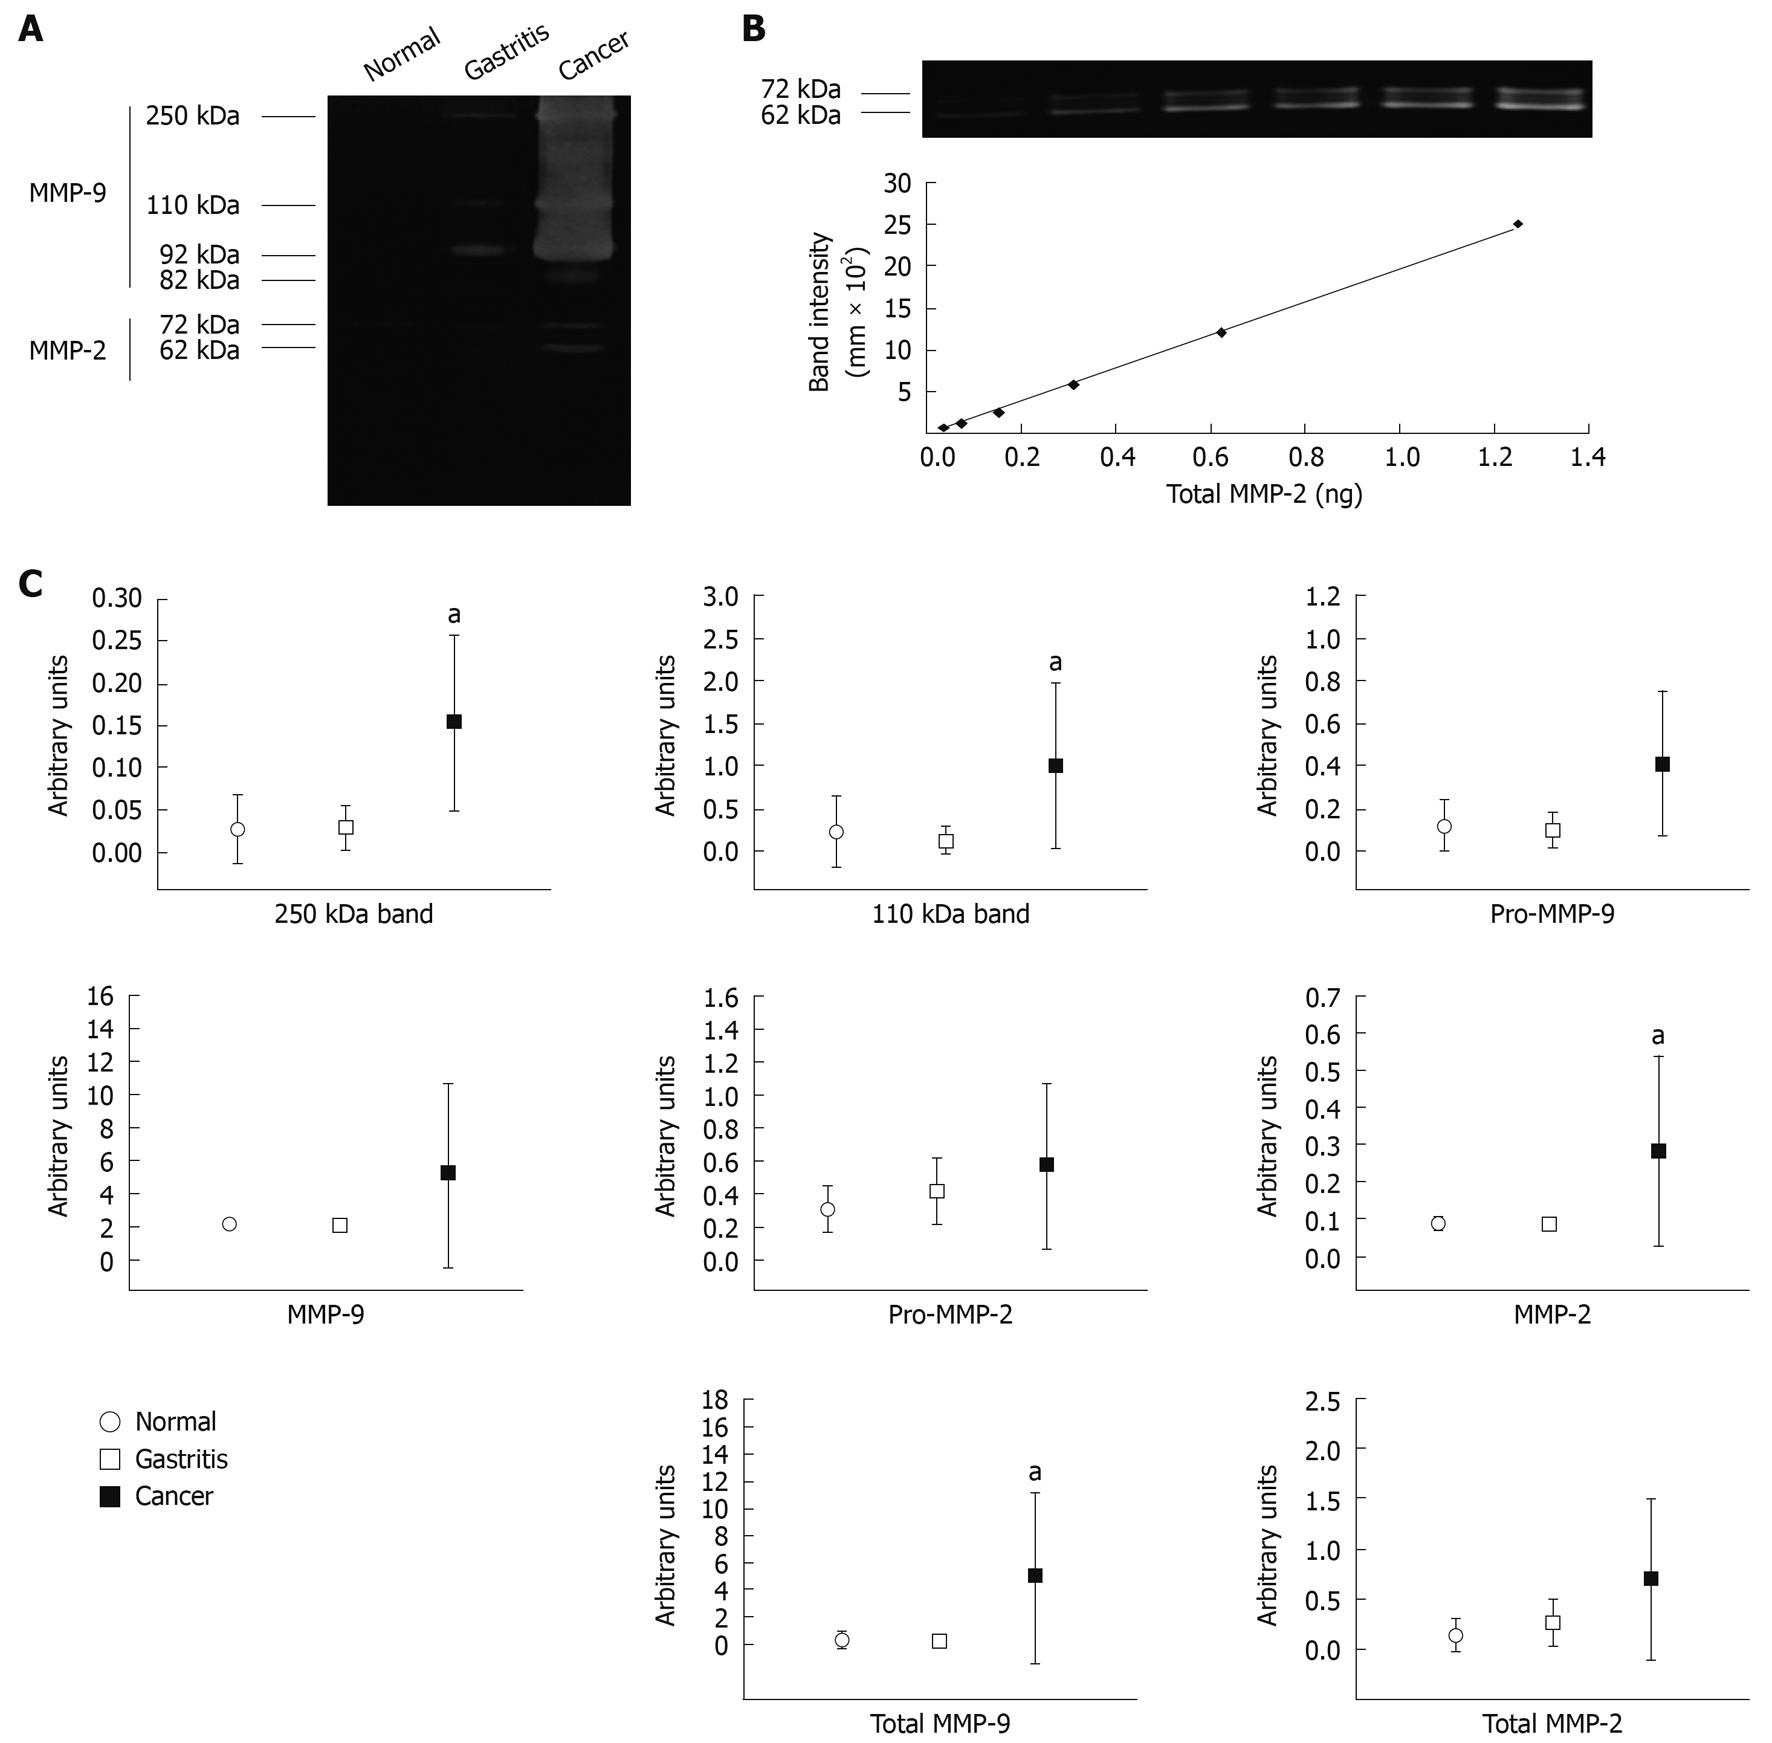
Figure 2 Validation of quantitative gelatin zymography (qGZ) of human mucosal biopsy homogenates.
A: Representative zymogram of tested samples; B: Representative standard curve generated from human recombinant MMP-2 across linear range of 0.039-1.25 ng/mL, used to generate arbitrary units from densitometric data; C: Differential gelatinase activity of each of the six bands activity detected in normal (open circle), gastritis (open square) and gastric cancer (close square). Error bars represent the mean ± SD. aP < 0.05 vs normal condition.
- Citation: Sampieri CL, de la Peña S, Ochoa-Lara M, Zenteno-Cuevas R, León-Córdoba K. Expression of matrix metalloproteinases 2 and 9 in human gastric cancer and superficial gastritis. World J Gastroenterol 2010; 16(12): 1500-1505
- URL: https://www.wjgnet.com/1007-9327/full/v16/i12/1500.htm
- DOI: https://dx.doi.org/10.3748/wjg.v16.i12.1500


