Copyright
©2009 The WJG Press and Baishideng.
World J Gastroenterol. Feb 28, 2009; 15(8): 983-989
Published online Feb 28, 2009. doi: 10.3748/wjg.15.983
Published online Feb 28, 2009. doi: 10.3748/wjg.15.983
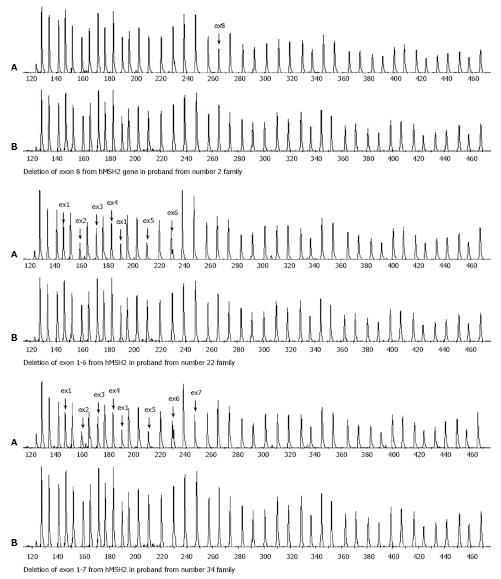
Figure 1 Large fragment deletion results with MLPA technique.
A indicates peak graph of fluorescence intensity of proband PCR products. B indicates peak graph of fluorescence intensity of control PCR products. ↓ indicates large fragment deletion in exon.
Figure 2 Electropherogram of hMLH1 gene promoter methylation detection.
M: Methylation; U: Non-methylation; H: Family number. H8 manifests partial methylation. H6 and H28 manifest exhaustive methylation.
- Citation: Sheng JQ, Zhang H, Ji M, Fu L, Mu H, Zhang MZ, Huang JS, Han M, Li AQ, Wei Z, Sun ZQ, Wu ZT, Xia CH, Li SR. Genetic diagnosis strategy of hereditary non-polyposis colorectal cancer. World J Gastroenterol 2009; 15(8): 983-989
- URL: https://www.wjgnet.com/1007-9327/full/v15/i8/983.htm
- DOI: https://dx.doi.org/10.3748/wjg.15.983


