Copyright
©2009 The WJG Press and Baishideng.
World J Gastroenterol. Feb 28, 2009; 15(8): 942-954
Published online Feb 28, 2009. doi: 10.3748/wjg.15.942
Published online Feb 28, 2009. doi: 10.3748/wjg.15.942
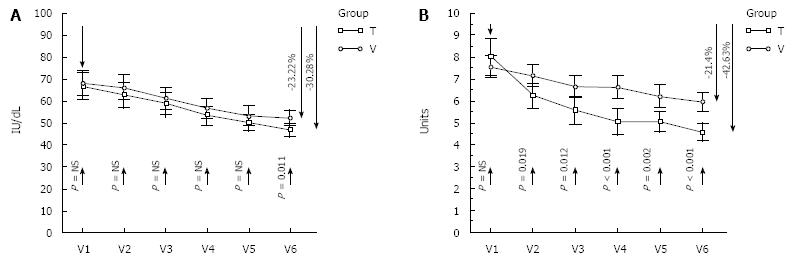
Figure 1 Primary parameters of the biochemical study.
Comparative dynamics for ALT and HOMA-IR from V1 to V6 in the study groups. A: ALT variation from V1 to V6; B: HOMA-IR variation from V1 to V6. ALT: Alanine-aminotransferase; HOMA-IR: Homeostasis model assessment index for insulin-resistance; V1 to V6: Number of scheduled visit; T: Telmisartan study group; V: Valsartan study group; NS: Not statistically significant.
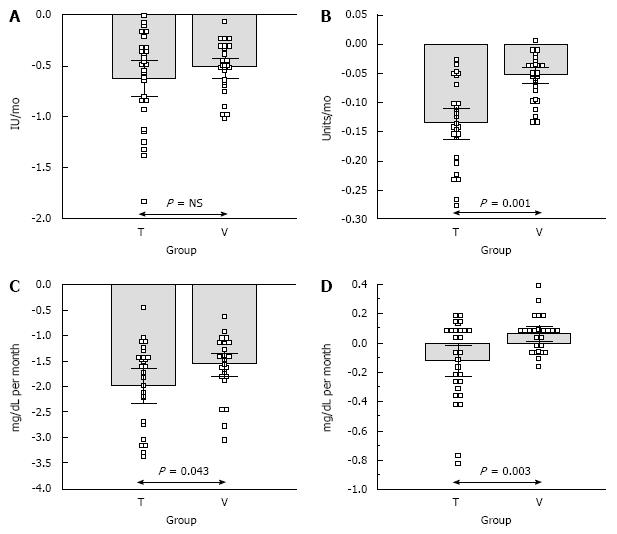
Figure 2 Derivate parameters of the biochemical study.
Comparisons (box-and whisker means) of the averaged decreases per month for ALT, HOMA-IR, TC and TG in the two study groups. A: Mean monthly decrease for ALT; B: Mean monthly decrease of HOMA-IR; C: Mean monthly decrease of triglycerides;
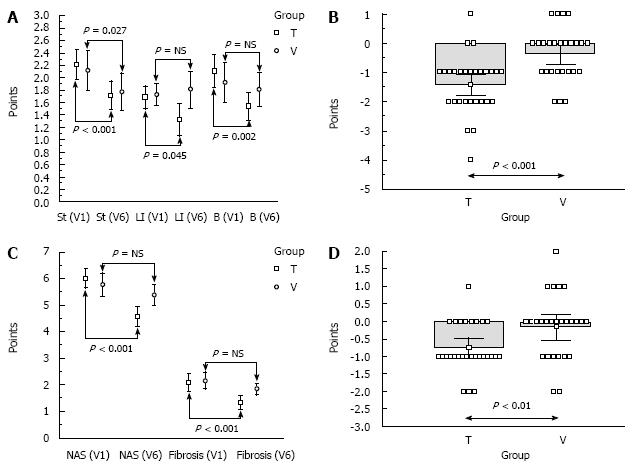
Figure 3 Histology study.
Comparisons of averaged decreases for NAS and its components and for the fibrosis scores between V1 and V6 among the study groups. A: Comparison between the values of NAS components at V6 vs V1; B: Mean NAS decrease in groups T and V; C: Comparison between the values of NAS and respectively fibrosis scores at V6 vs V1; D: Mean decrease of fibrosis scores in groups T and V. St: Steatosis; LI: Lobular inflammation; B: Ballooning; NAS: NASH activity score; V1: Index data at visit 1; V6: End-of-treatment data; NS: Not statistically significant.
- Citation: Georgescu EF, Ionescu R, Niculescu M, Mogoanta L, Vancica L. Angiotensin-receptor blockers as therapy for mild-to-moderate hypertension-associated non-alcoholic steatohepatitis. World J Gastroenterol 2009; 15(8): 942-954
- URL: https://www.wjgnet.com/1007-9327/full/v15/i8/942.htm
- DOI: https://dx.doi.org/10.3748/wjg.15.942


