Copyright
©2009 The WJG Press and Baishideng.
World J Gastroenterol. Feb 28, 2009; 15(8): 936-941
Published online Feb 28, 2009. doi: 10.3748/wjg.15.936
Published online Feb 28, 2009. doi: 10.3748/wjg.15.936
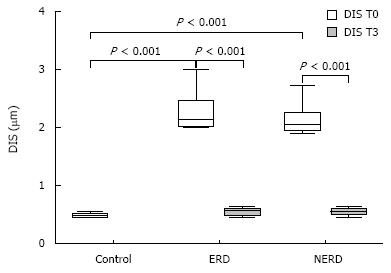
Figure 1 Box-plots of dilation of intercellular spaces (DIS) values, DIS median (bold line in the box), and interquartile range (upper and lower lines of the box) in human esophageal mucosa of healthy controls and ERD and NERD patients at baseline (T0) and after 3 mo of therapy (T3).
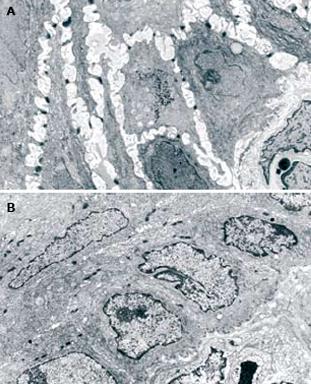
Figure 2 Photomicrographs of esophageal mucosa, obtained using TEM of the suprabasal layer (original magnification, x 3500), showing DIS before (A) and after pantoprazole treatment (B).
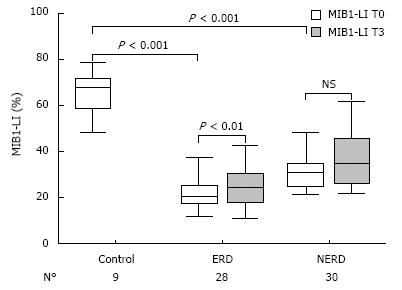
Figure 3 Box plots of MIB1-LI values, LI median (bold line in the box), and interquartile range (upper and lower lines of the box) in human esophageal mucosa of healthy controls and ERD and NERD patients, basal (T0) and after 3 mo of therapy (T3).
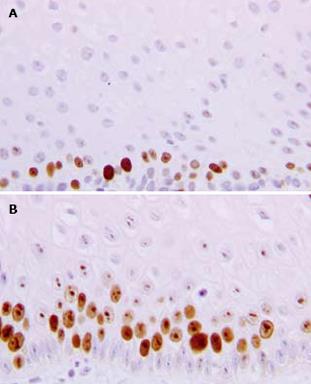
Figure 4 MIB 1 immunostaining of histological sections from an ERD patient at baseline (A) and after 3 mo of therapy (B).
Note the increase in the number of proliferating cells after pantoprazole treatment.
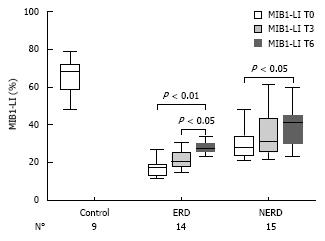
Figure 5 Box plots of MIB1-labelling index (LI), LI median (bold line in the box), and interquartile range (upper and lower lines of the box) in human esophageal mucosa of healthy controls and of randomized patients with ERD and NERD at baseline and after 3 and 6 mo.
- Citation: Calabrese C, Treré D, Liguori G, Gabusi V, Vici M, Cenacchi G, Derenzini M, Febo GD. Esophageal cell proliferation in gastroesophageal reflux disease: Clinical-morphological data before and after pantoprazole. World J Gastroenterol 2009; 15(8): 936-941
- URL: https://www.wjgnet.com/1007-9327/full/v15/i8/936.htm
- DOI: https://dx.doi.org/10.3748/wjg.15.936


