Copyright
©2009 The WJG Press and Baishideng.
World J Gastroenterol. Feb 28, 2009; 15(8): 927-935
Published online Feb 28, 2009. doi: 10.3748/wjg.15.927
Published online Feb 28, 2009. doi: 10.3748/wjg.15.927
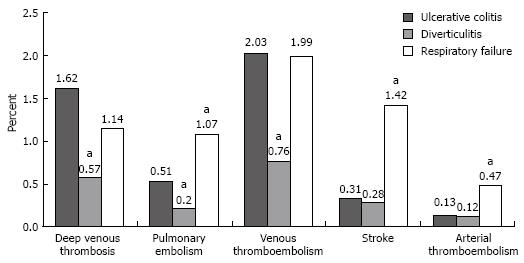
Figure 1 Rates of different thromboembolic events in non-surgical comparison groups.
Confidence intervals for the individual rates are shown in Table 2. aP < 0.05, vs the ulcerative colitis discharges.
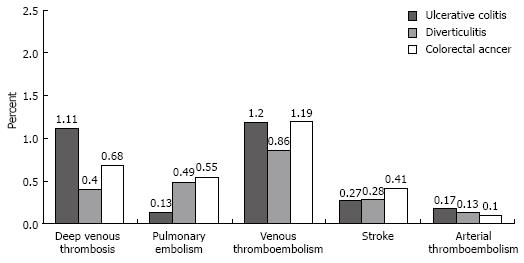
Figure 2 Rates of different thromboembolic events in surgical comparison groups.
Confidence intervals for the individual rates are shown in Table 3.
- Citation: Wang JY, Terdiman JP, Vittinghoff E, Minichiello T, Varma MG. Hospitalized ulcerative colitis patients have an elevated risk of thromboembolic events. World J Gastroenterol 2009; 15(8): 927-935
- URL: https://www.wjgnet.com/1007-9327/full/v15/i8/927.htm
- DOI: https://dx.doi.org/10.3748/wjg.15.927


