Copyright
©2009 The WJG Press and Baishideng.
World J Gastroenterol. Feb 14, 2009; 15(6): 742-747
Published online Feb 14, 2009. doi: 10.3748/wjg.15.742
Published online Feb 14, 2009. doi: 10.3748/wjg.15.742
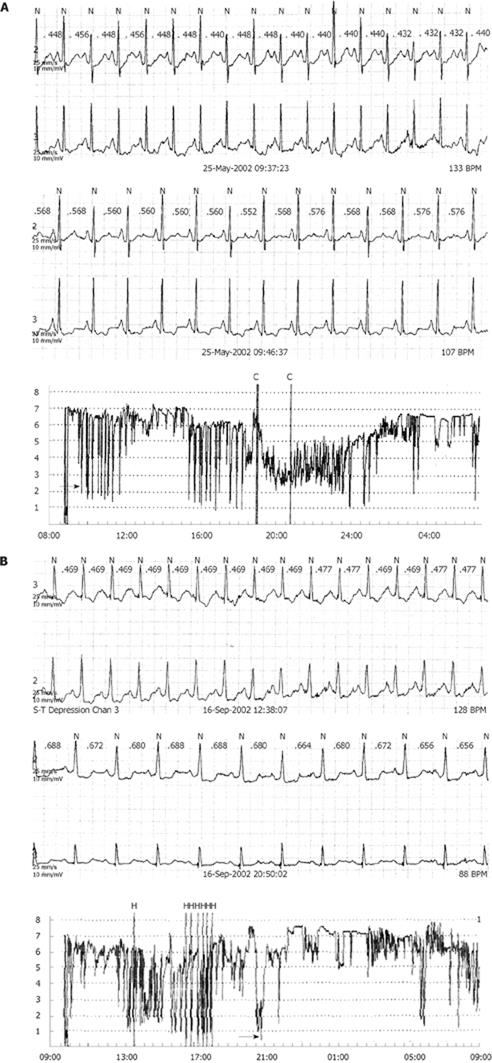
Figure 1 Curves of 24-h intra-esophageal pH monitoring and Holter electrocardiography in a patient with abnormal gastroesophageal reflux show the decreasing amplitude of the ST segment.
A: Ranged from 0.05 mV to 0.15 mV in 9 min. The results also indicate that abnormal gastroesophageal reflux occurred during this period; B: 0.1 mV to 0.3 mV in from 12:38:07 to 20:50:02. The results also indicate that abnormal gastro-esophageal reflux occurred during this period.
- Citation: Deng B, Wang RW, Jiang YG, Tan QY, Liao XL, Zhou JH, Zhao YP, Gong TQ, Ma Z. Diagnosis of chest pain with foregut symptoms in Chinese patients. World J Gastroenterol 2009; 15(6): 742-747
- URL: https://www.wjgnet.com/1007-9327/full/v15/i6/742.htm
- DOI: https://dx.doi.org/10.3748/wjg.15.742


