Copyright
©2009 The WJG Press and Baishideng.
World J Gastroenterol. Feb 14, 2009; 15(6): 717-721
Published online Feb 14, 2009. doi: 10.3748/wjg.15.717
Published online Feb 14, 2009. doi: 10.3748/wjg.15.717
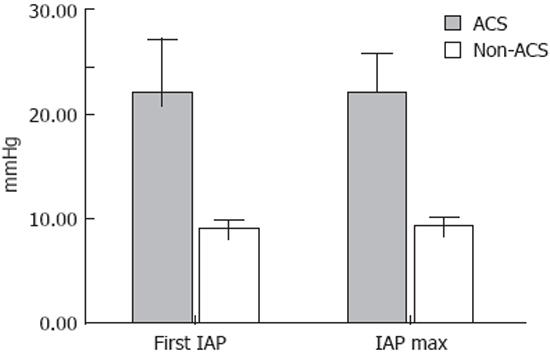
Figure 1 The 1st IAP and maximal IAP value in ACS and non-ACS groups.
All patients were divided in ACS (grey colour) and non-ACS (white colour) groups. Median IAP at admission was 22.0 and 9.25 mmHg in ACS and non-ACS groups respectively (P < 0.01). There was no significant difference between value of the 1st measurement and maximum observed value of IAP within each group.
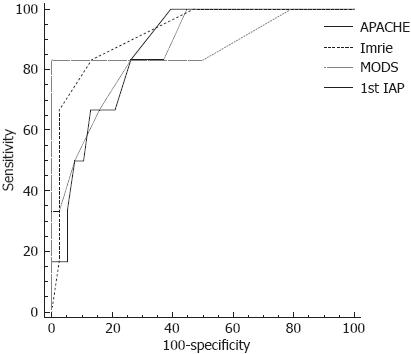
Figure 2 ROC curve analysis of prognostic factors for ACS development.
ROC analysis revealed that clinical scores (APACHE II, Glasgow-Imrie and MODS) and first IAP measurement on admission are good prognostic markers in determining patients who are likely to develop ACS. There was no significant difference between the areas under the ROC curves for these prognostic markers.
- Citation: Dambrauskas Z, Parseliunas A, Gulbinas A, Pundzius J, Barauskas G. Early recognition of abdominal compartment syndrome in patients with acute pancreatitis. World J Gastroenterol 2009; 15(6): 717-721
- URL: https://www.wjgnet.com/1007-9327/full/v15/i6/717.htm
- DOI: https://dx.doi.org/10.3748/wjg.15.717


