Copyright
©2009 The WJG Press and Baishideng.
World J Gastroenterol. Dec 21, 2009; 15(47): 5946-5952
Published online Dec 21, 2009. doi: 10.3748/wjg.15.5946
Published online Dec 21, 2009. doi: 10.3748/wjg.15.5946
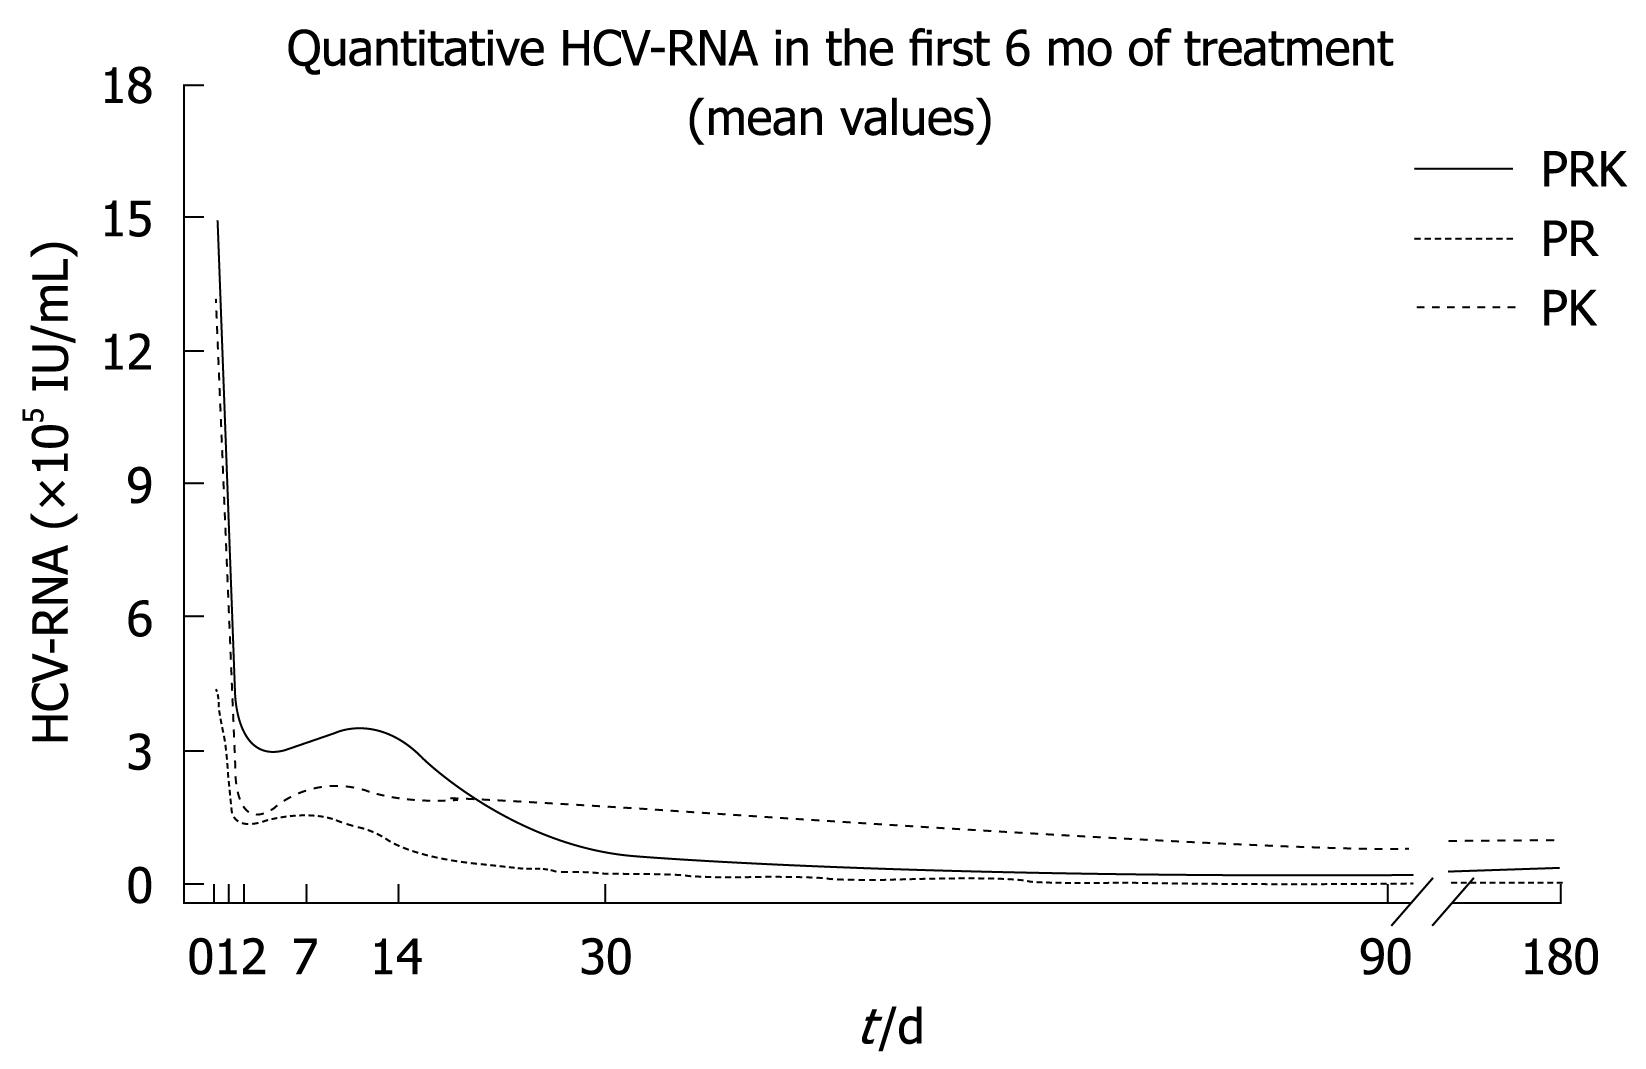
Figure 1 Mean hepatitis C virus (HCV)-RNA levels during the first 24 wk of treatment in patients with HCV genotype 1 infection receiving PEG-IFNα2a plus ribavirin (PR) or PEG-IFNα2a plus ketoprofen (PK) or PEG-IFNα2a plus ribavirin and ketoprofen (PRK).
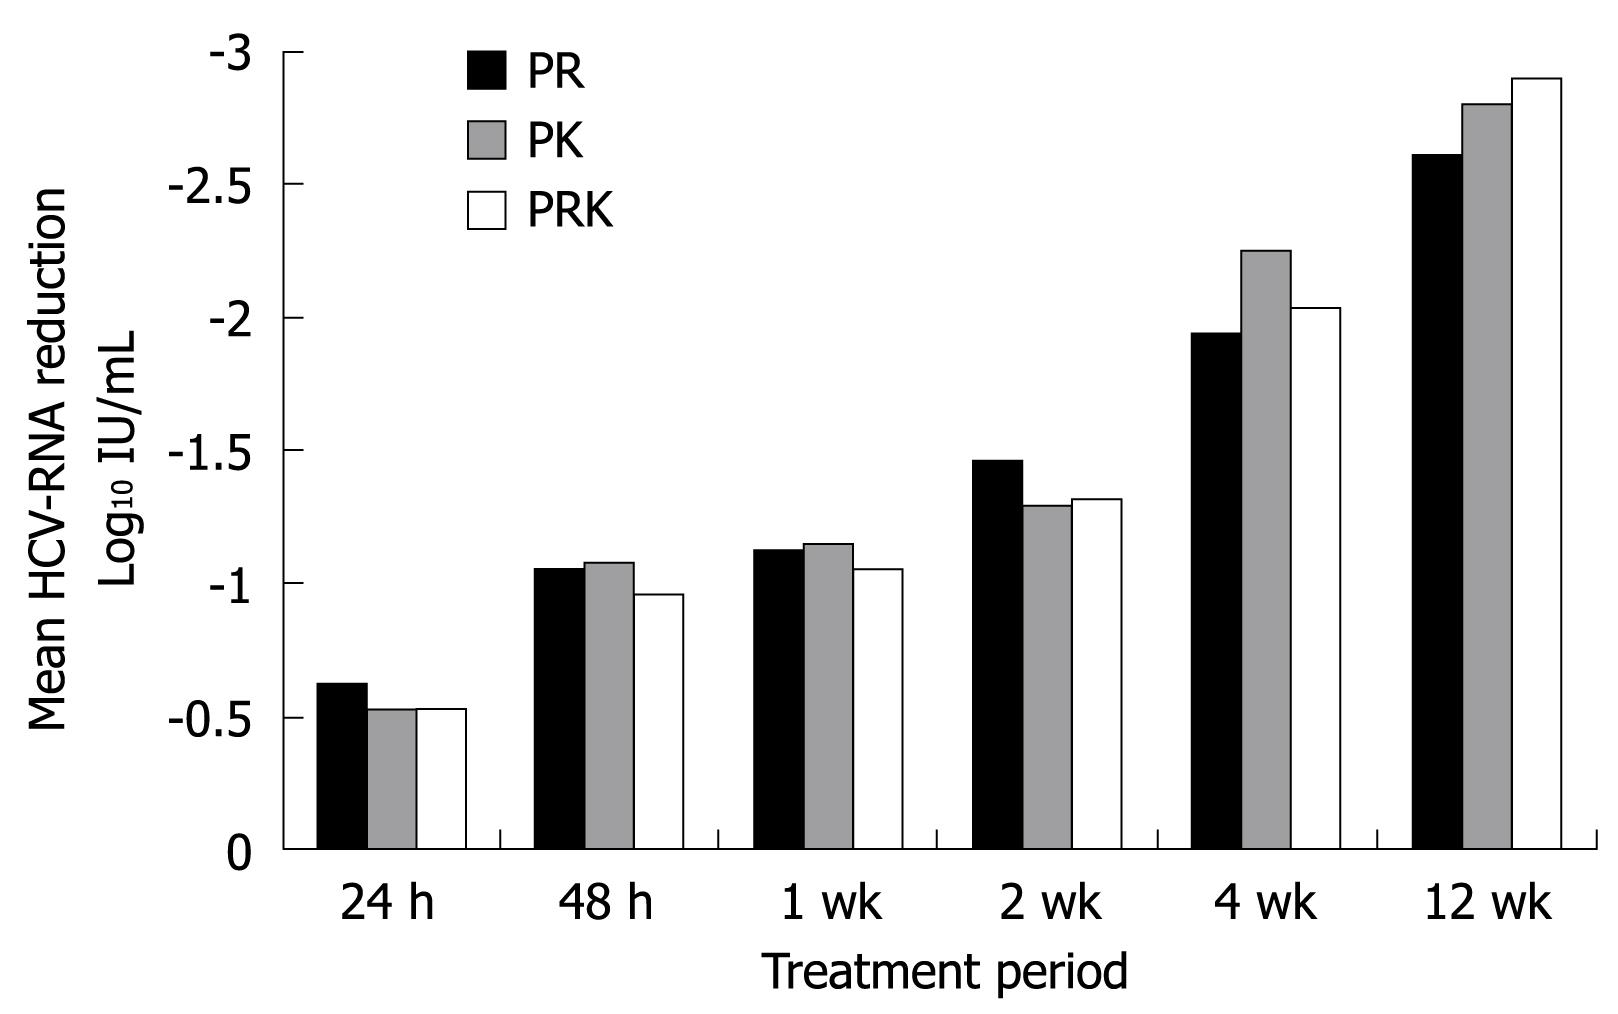
Figure 2 Mean reduction from baseline in log10 HCV-RNA levels in patients with HCV genotype 1 infection receiving PR or PK or PRK.
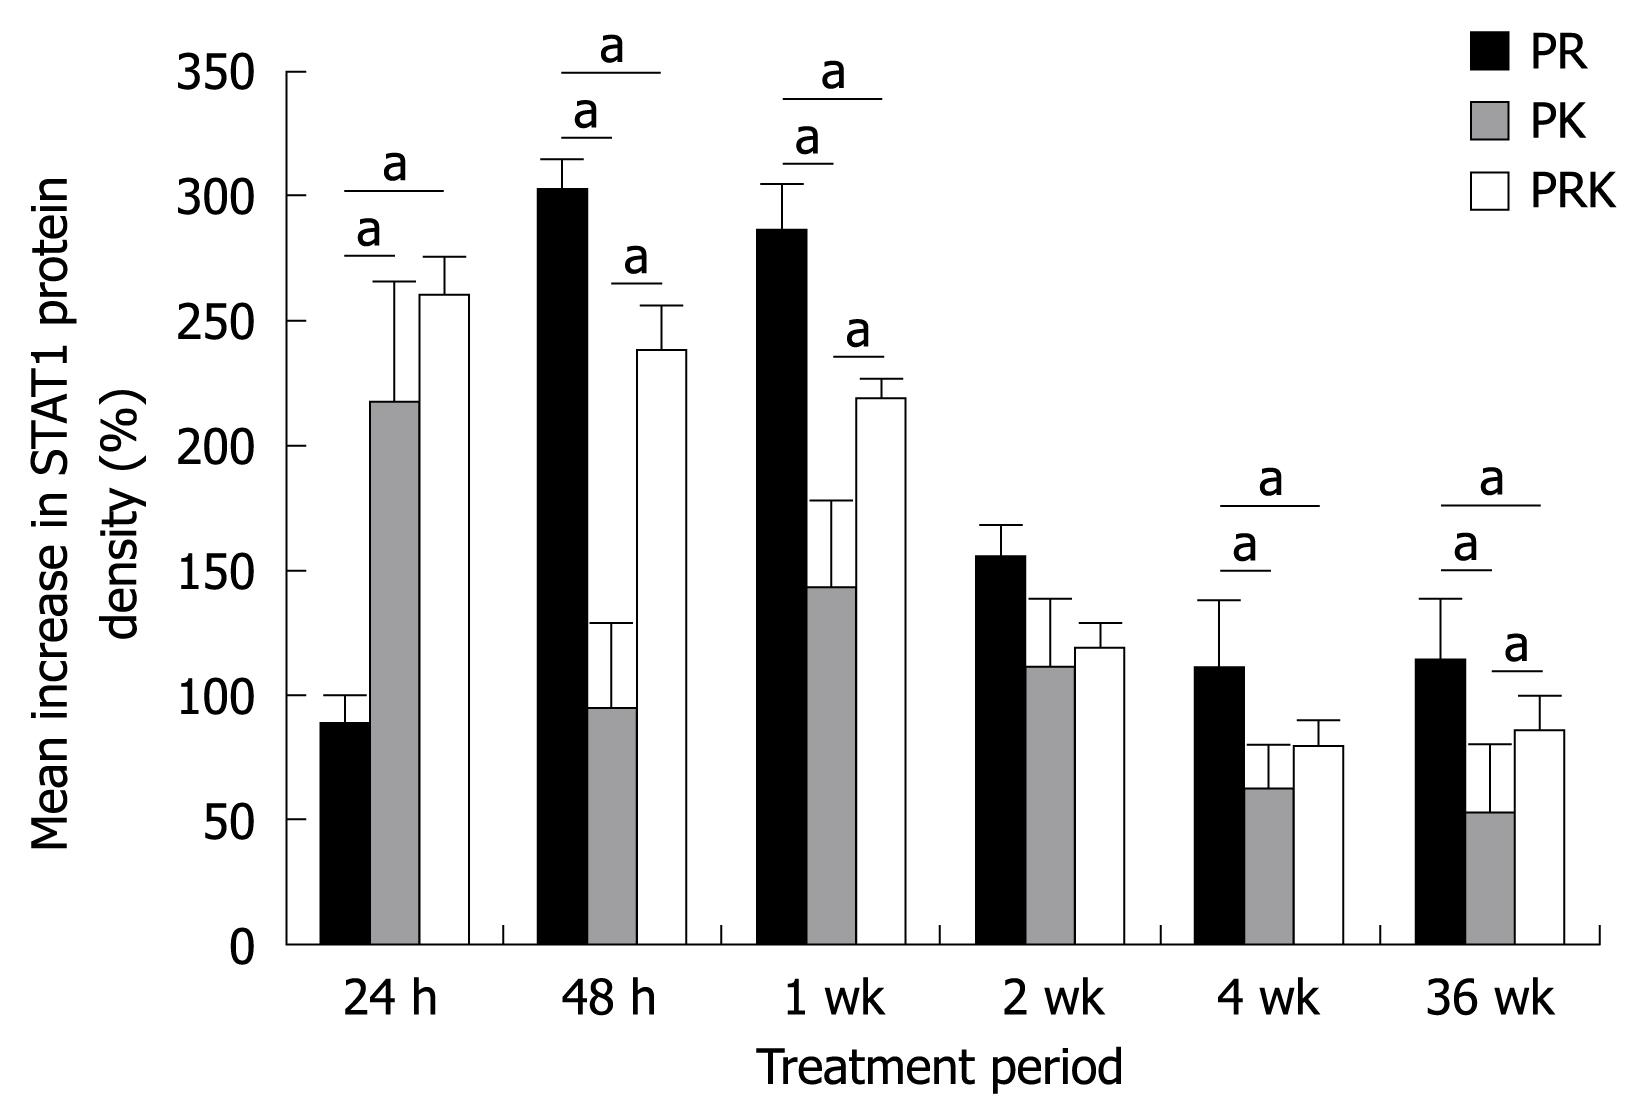
Figure 3 Mean percentage increase from baseline in STAT1 protein density in patients with HCV genotype 1 infection receiving PR or PK or PRK.
Data are presented as the mean (± SD) percentage increase over basal activity in STAT1, assessed by densitometric analysis. aP < 0.05.
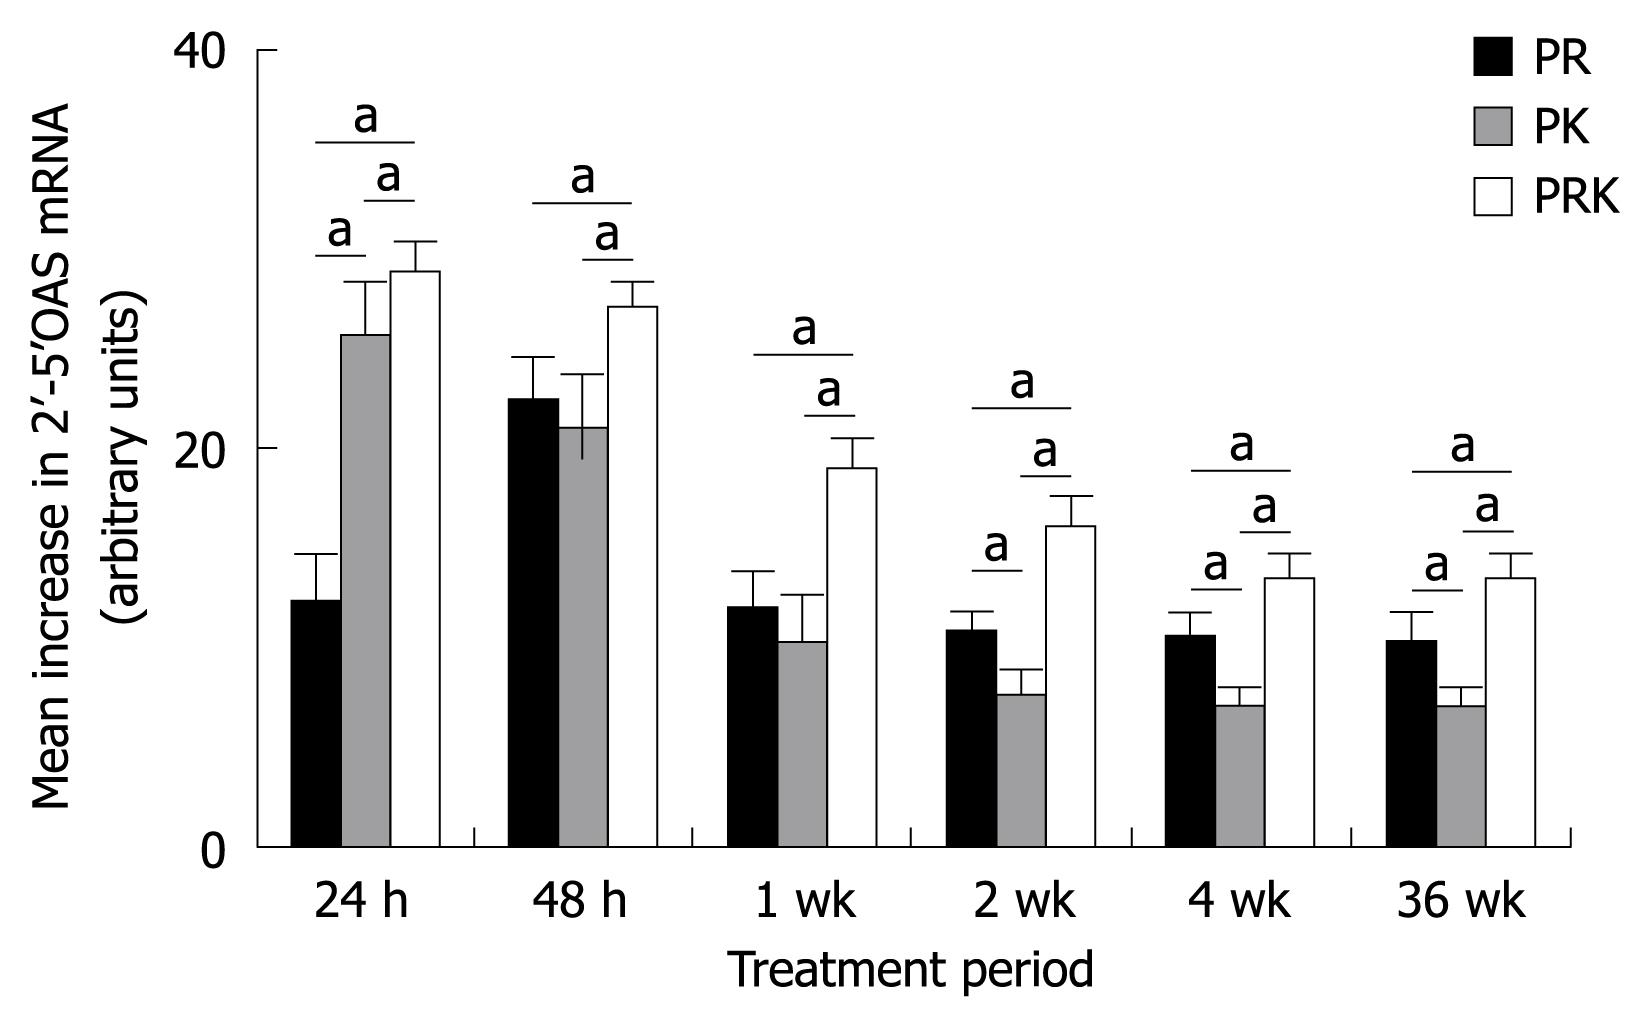
Figure 4 2’-5’-oligoadenylate synthetase (2’-5’OAS) induction in patients with HCV genotype 1 infection receiving PR or PK or PRK.
Data are presented as the mean (± SD) fold increase over basal activity in 2’-5’OAS mRNA levels, assessed by RTQ-PCR. aP < 0.05.
- Citation: Gramenzi A, Cursaro C, Margotti M, Balsano C, Spaziani A, Anticoli S, Loggi E, Salerno M, Galli S, Furlini G, Bernardi M, Andreone P. Ketoprofen, peginterferon 2a and ribavirin for genotype 1 chronic hepatitis C: A phase II study. World J Gastroenterol 2009; 15(47): 5946-5952
- URL: https://www.wjgnet.com/1007-9327/full/v15/i47/5946.htm
- DOI: https://dx.doi.org/10.3748/wjg.15.5946


