Copyright
©2009 The WJG Press and Baishideng.
World J Gastroenterol. Dec 21, 2009; 15(47): 5924-5935
Published online Dec 21, 2009. doi: 10.3748/wjg.15.5924
Published online Dec 21, 2009. doi: 10.3748/wjg.15.5924
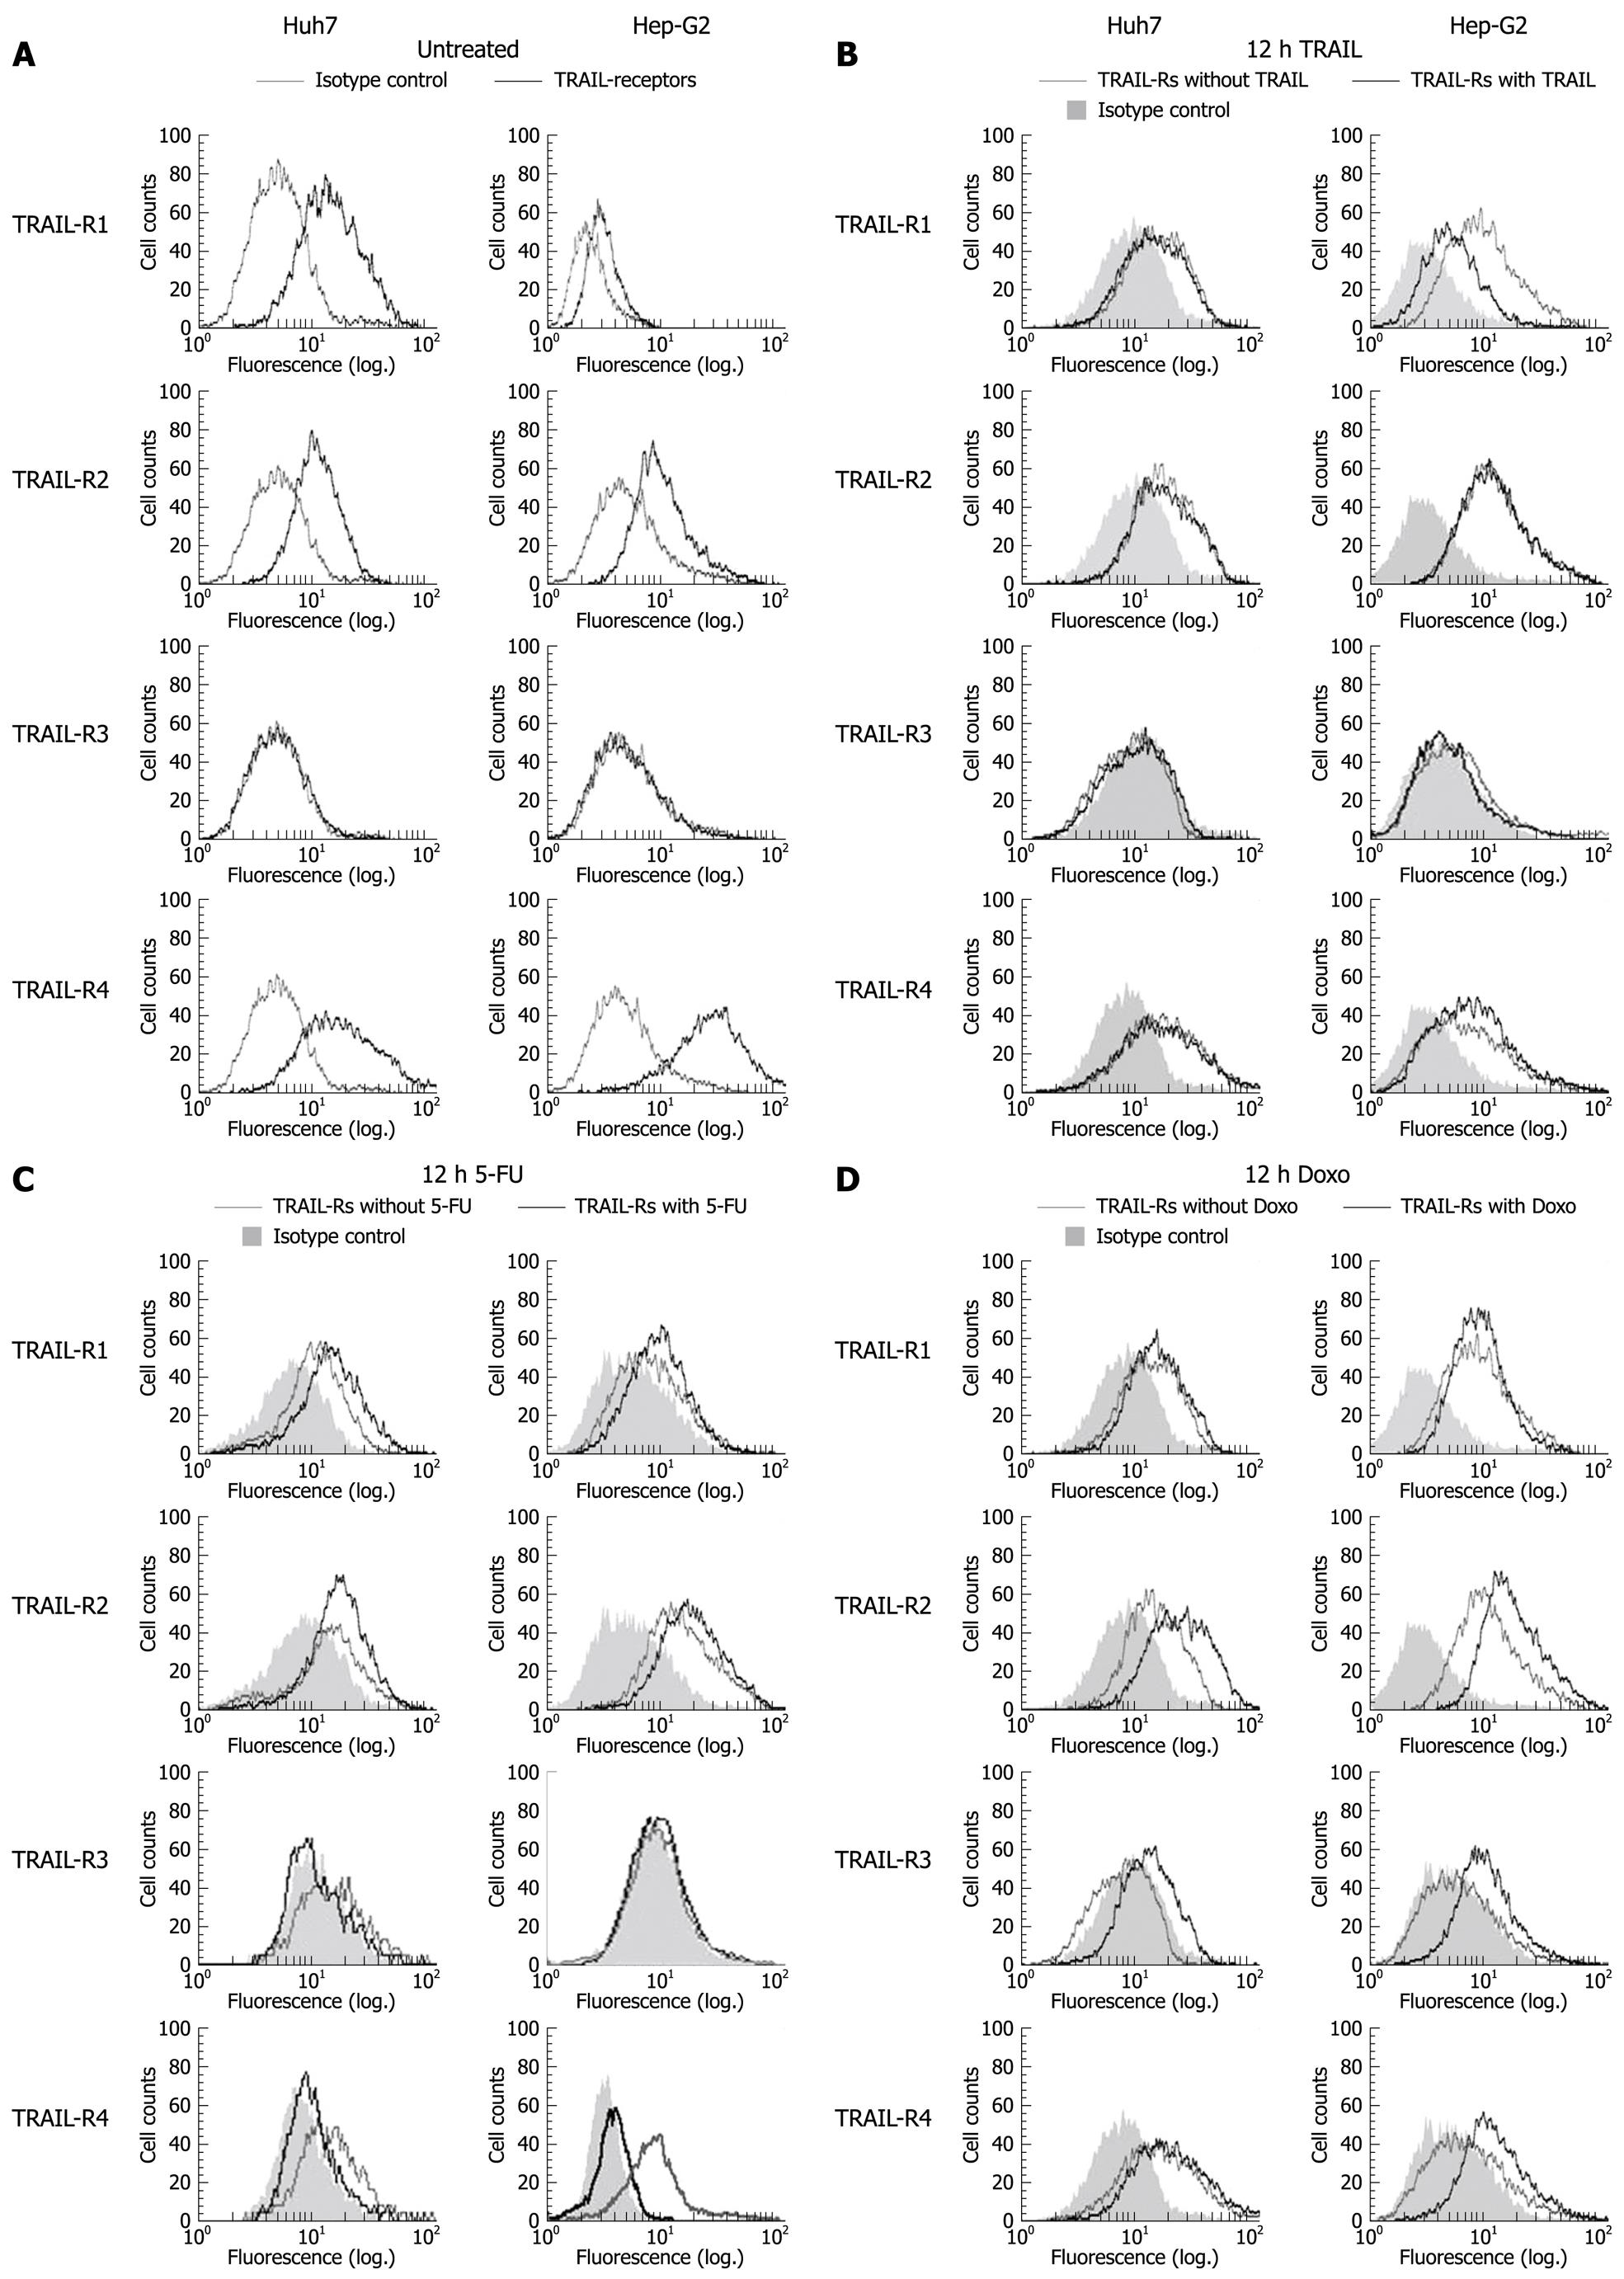
Figure 1 Surface expression of tumor necrosis factor-related apoptosis inducing ligand (TRAIL) receptors on Huh7 and Hep-G2 cells.
Flow cytometric analysis of TRAIL receptors was performed using monoclonal mouse IgG1, anti-TRAIL-R1, -R2, -R3, -R4 antibodies and secondary FITC-conjugated polyclonal goat anti mouse-IgG1 antibodies. Unspecific mouse IgG1 antibodies were used as isotype control. Receptor surface expression was analyzed in untreated Huh7 and Hep-G2 cells (A) and 12 h after treatment with 100 ng/mL rec. TRAIL + 1 μg/mL Enhancer (B), 50 μg/mL 5-fluorouracil (5-FU) (C) and 0.5 μmol/L doxorubicin (D). Diagrams are representative of at least two independent experiments. Doxo: Doxorubicin.
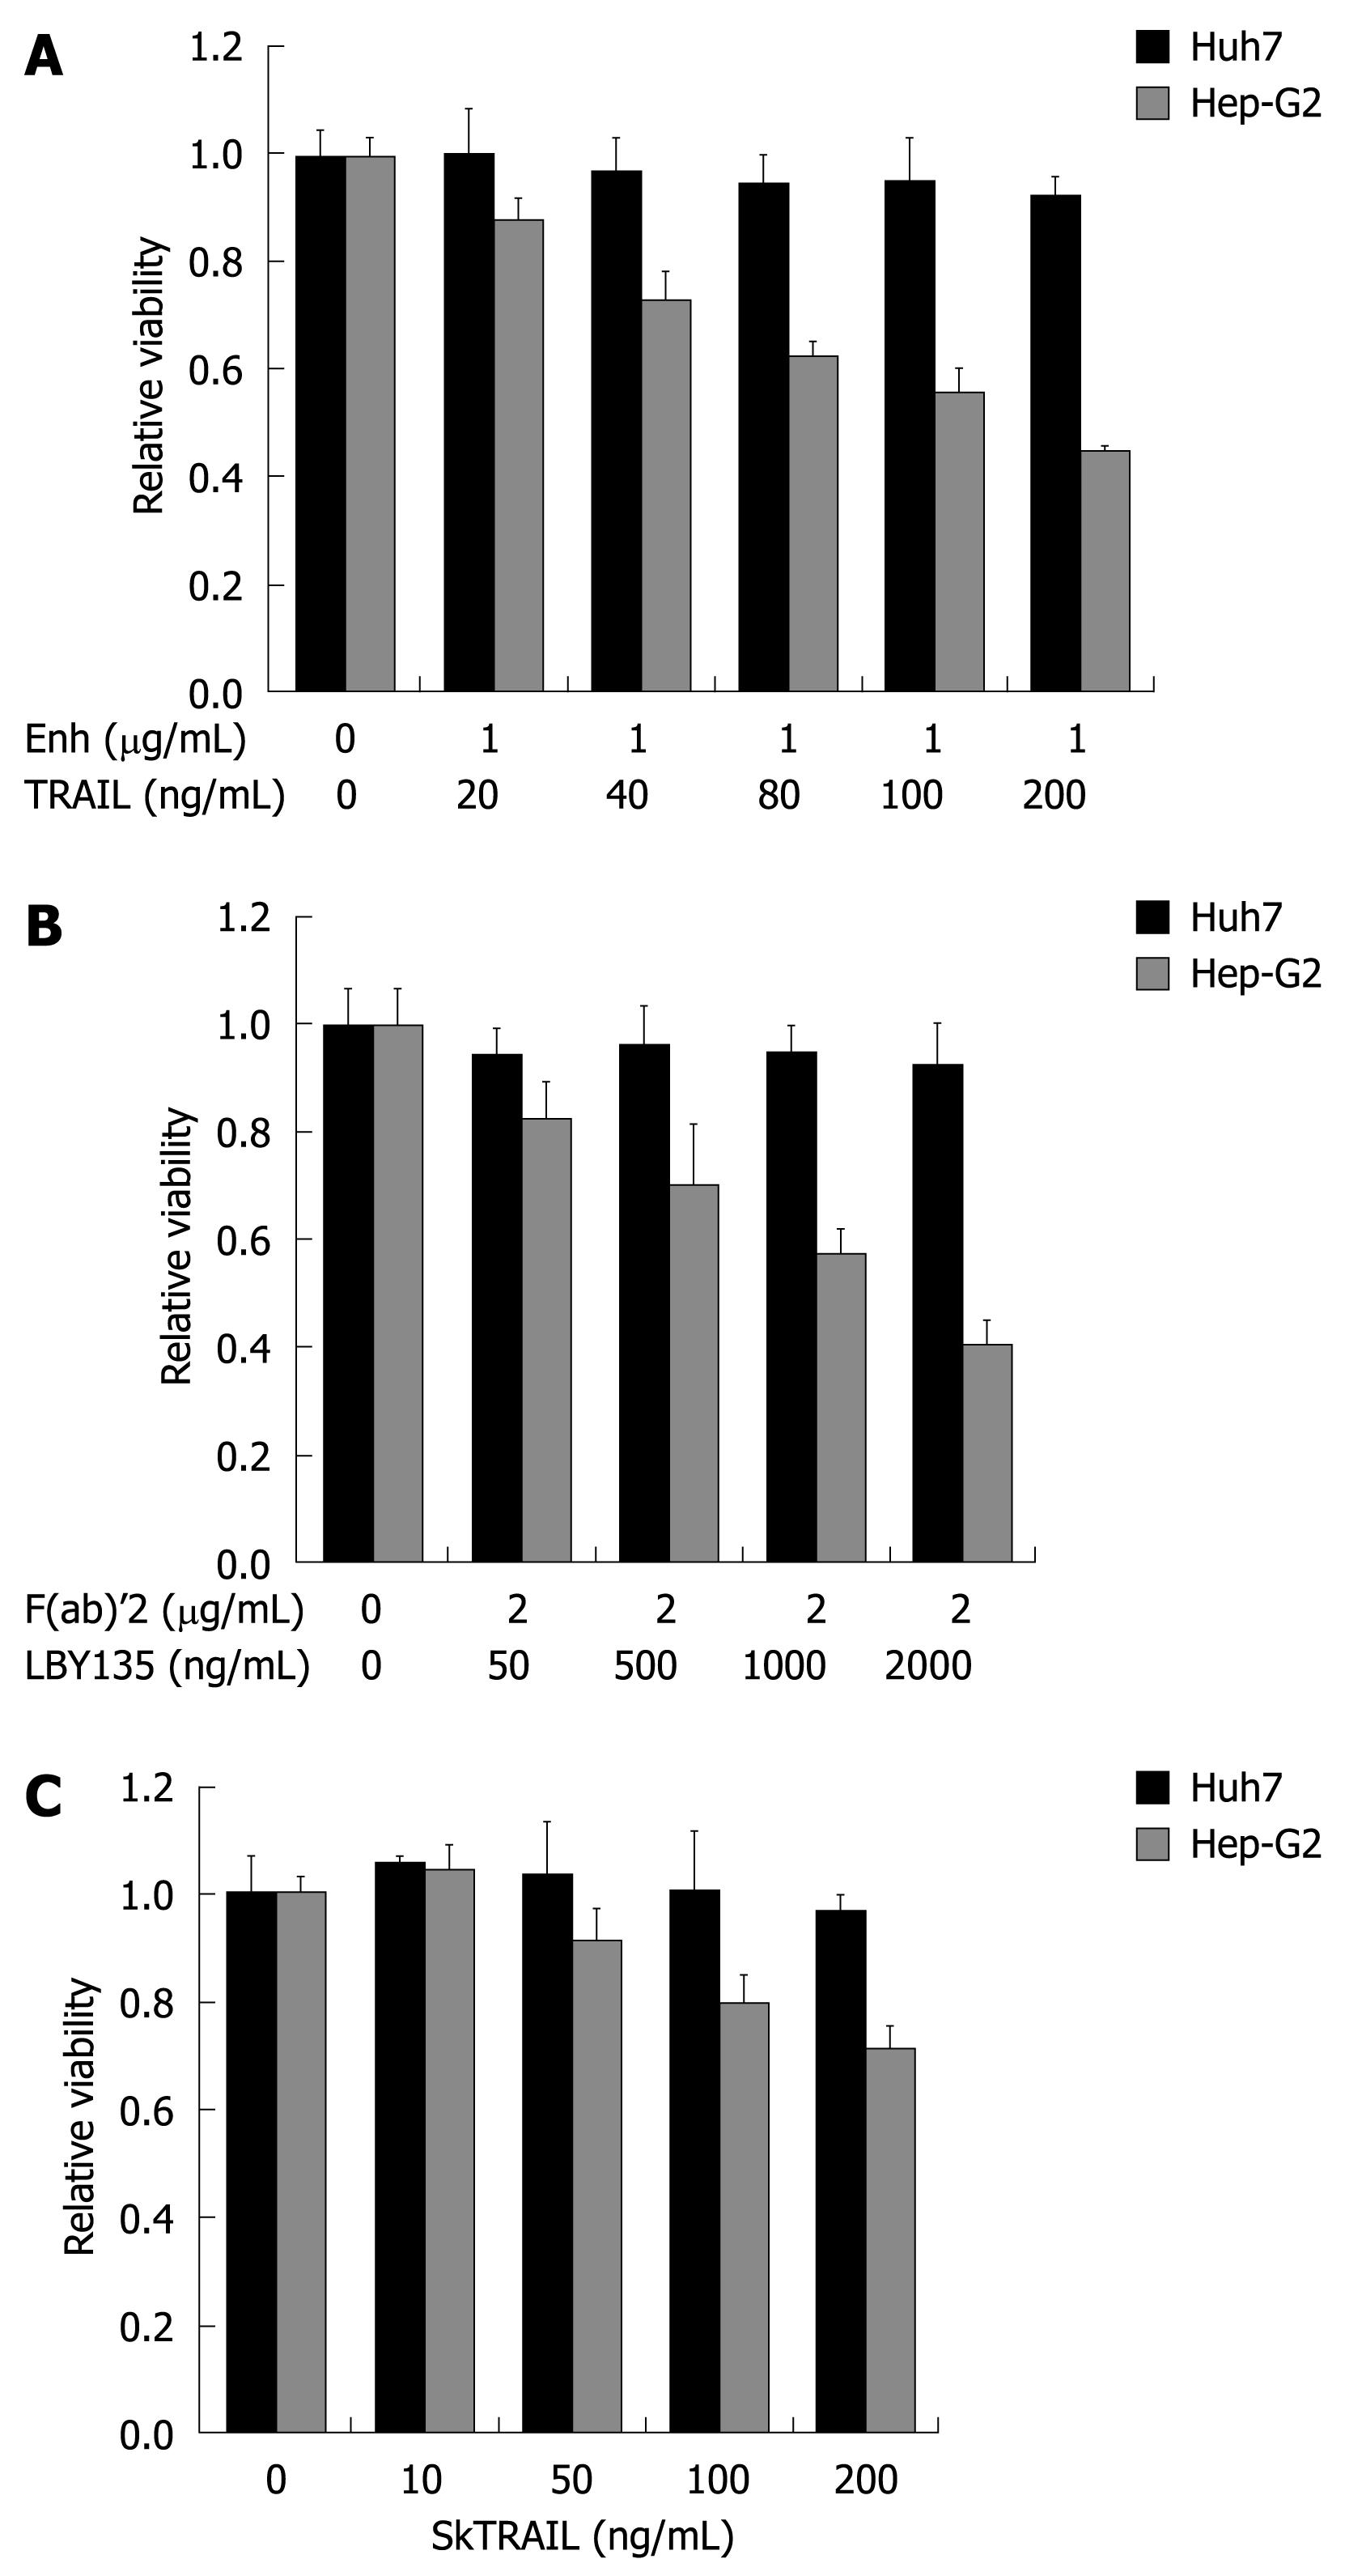
Figure 2 TRAIL-induced apoptosis in hepatocellular carcinoma (HCC) cells.
Huh7 and Hep-G2 cells were seeded onto 96-well plates and treated on day one after seeding with different TRAIL compounds. A: Cells were treated for 48 h with rec. TRAIL + 1 μg/mL Enhancer as indicated; B: Plates were coated with crosslinker IgG F(ab)’2 for 24 h before seeding of cells. Cells were then treated for 48 h with LBY135 + 1 μg/mL F(ab)’2 as indicated; C: Cells were treated for 48 h with SkTRAIL as indicated. Cell viability was analyzed by MTT assay. Viability is shown relative to untreated controls. Assays were performed in six-fold values and are representative of three independent experiments. Values are expressed as mean ± SD. Enh: Enhancer.
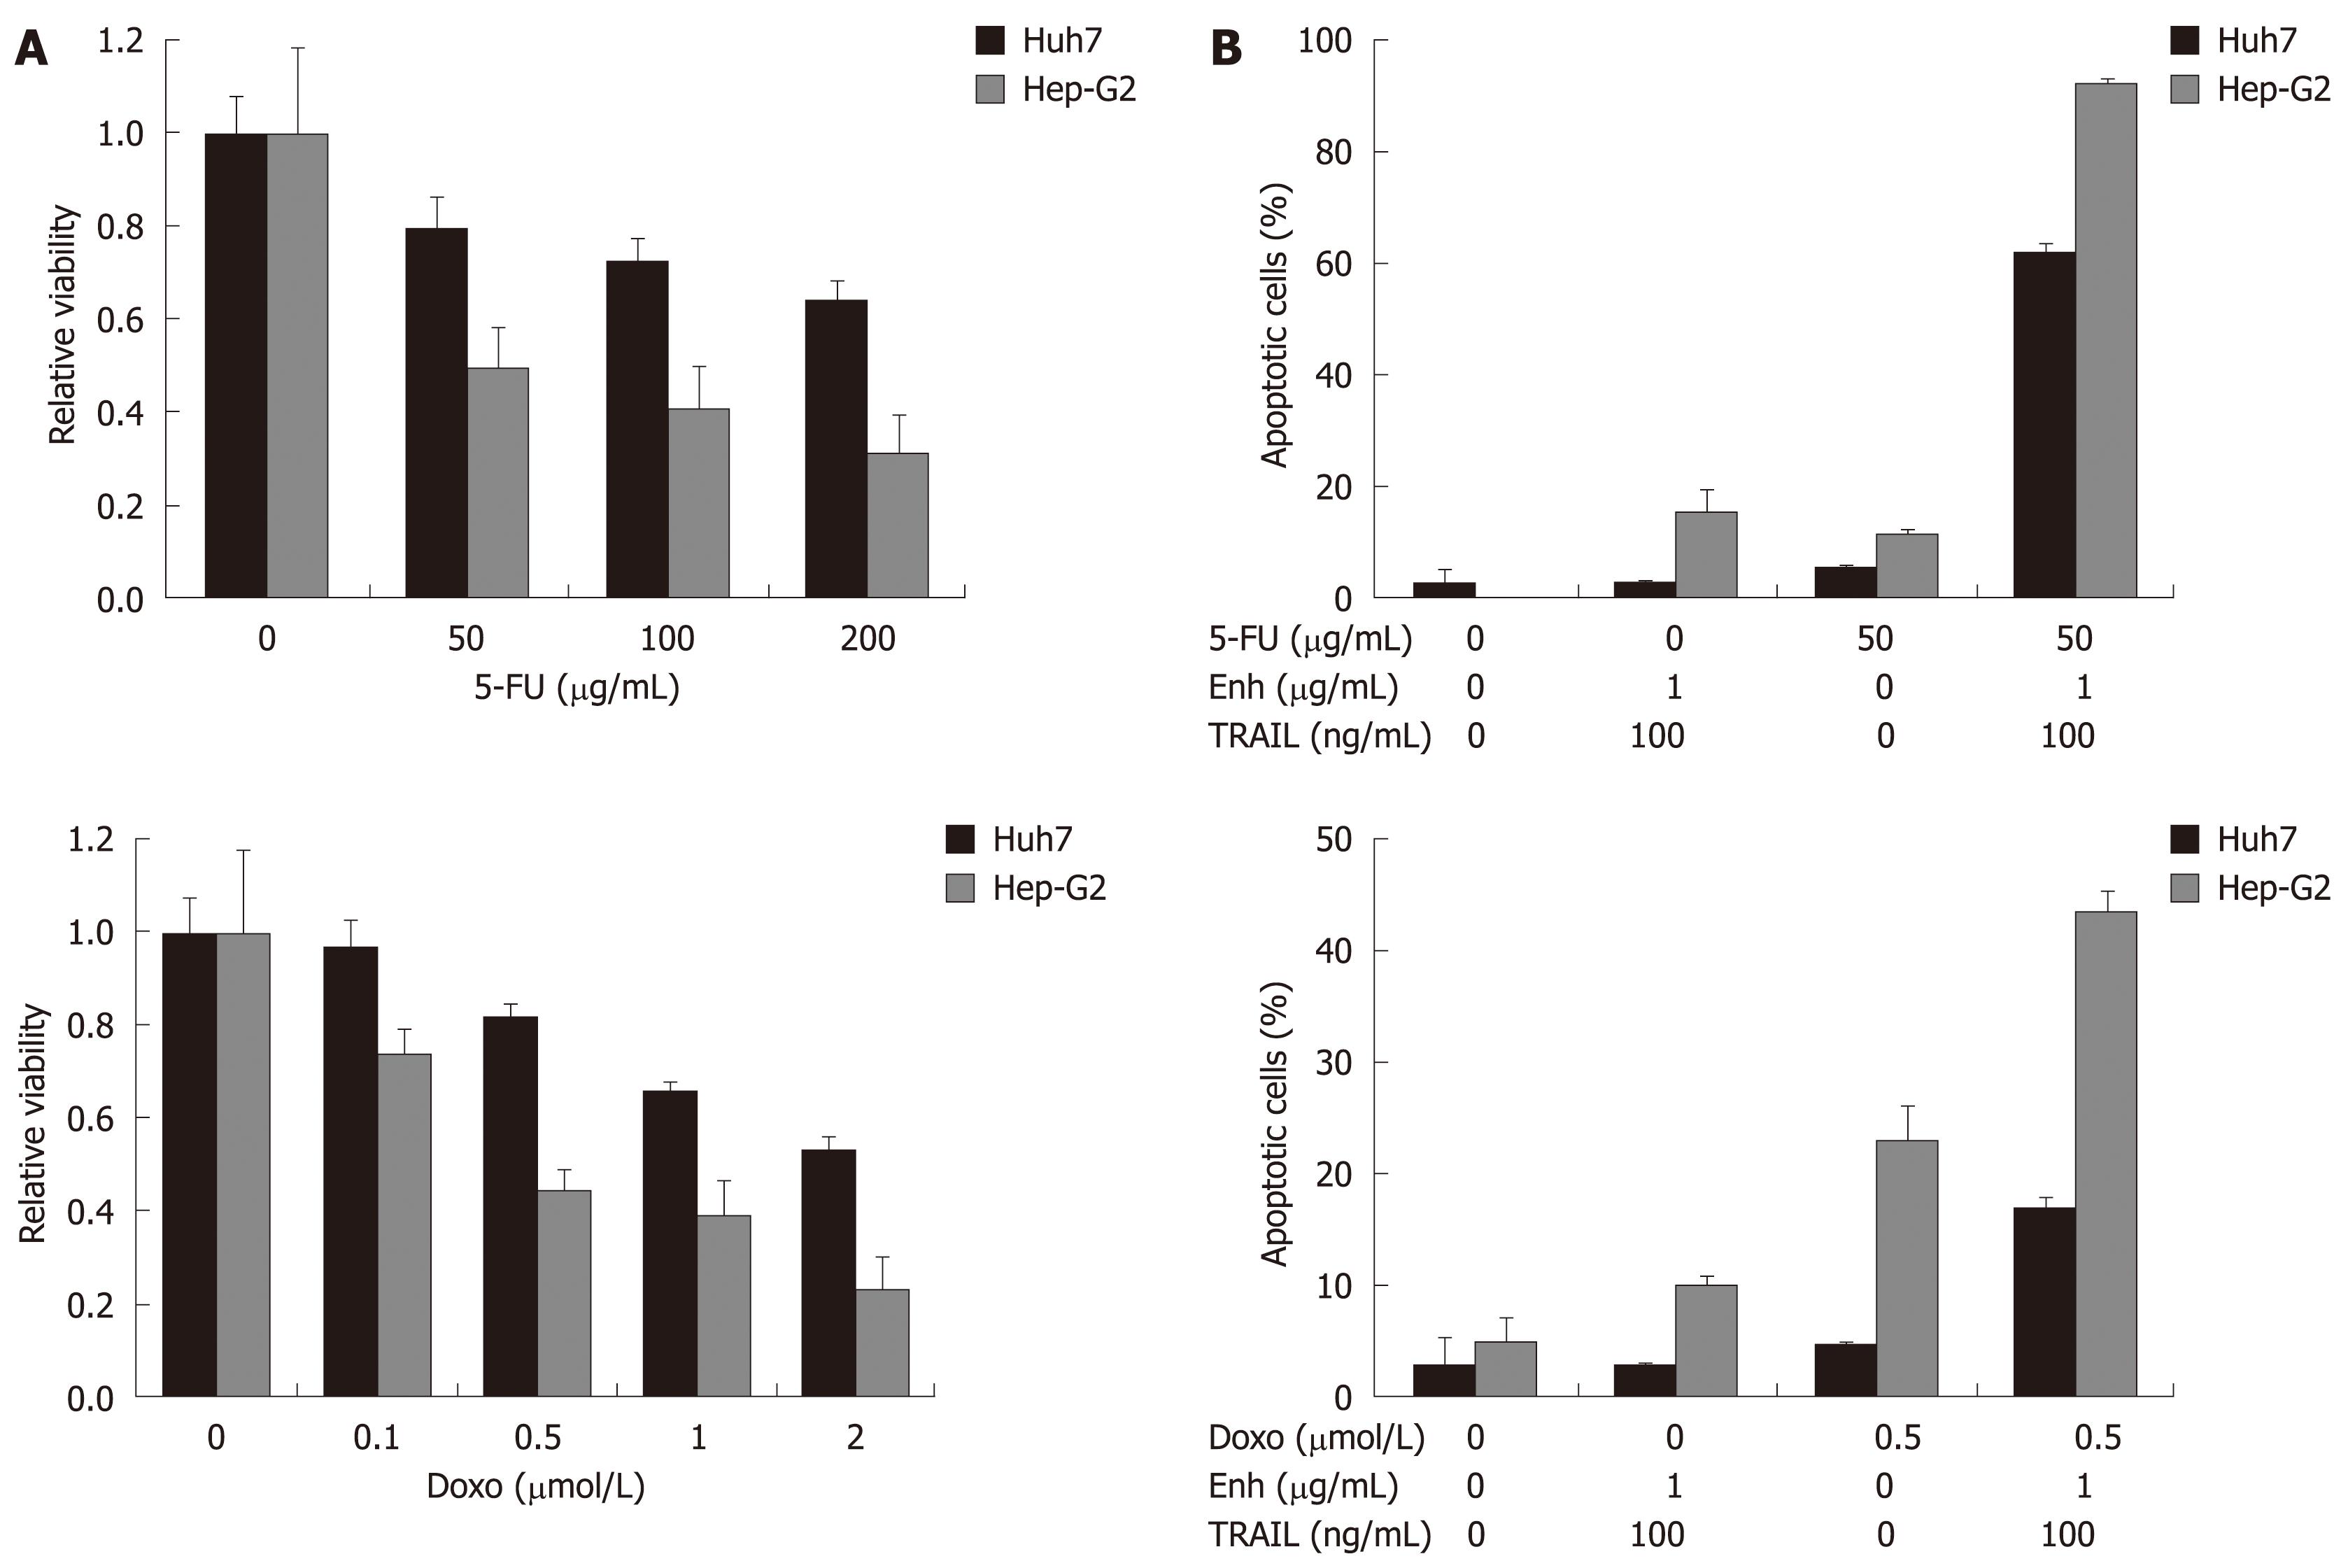
Figure 3 Treatment of HCC cells with TRAIL in combination with 5-FU and doxorubicin.
Values are expressed as mean ± SD. A: Huh7 and Hep-G2 cells were analyzed for cell viability after treatment with the chemotherapeutic agents 5-FU and doxorubicin alone. Cells were seeded onto 96-well plates and treated on day one after seeding. Cells were treated for 48 h with 5-FU (upper left panel) and doxorubicin (lower left panel) as indicated. Cell viability was analyzed by MTT assay. Viability is shown relative to untreated controls. Assays were performed in six-fold values; B: Apoptosis induction in Huh7 and Hep-G2 cells treated with 50 μg/mL 5-FU (upper right panel) and 0.5 μmol/L doxorubicin (lower right panel) either alone or in combination with 100 ng/mL TRAIL + 1 μg/mL Enhancer. Cells were seeded onto 12-well plates, harvested 48 h after treatment and analyzed for apoptosis induction by flow cytometry. Assays were performed in triplicate and are representative of at least two independent experiments.
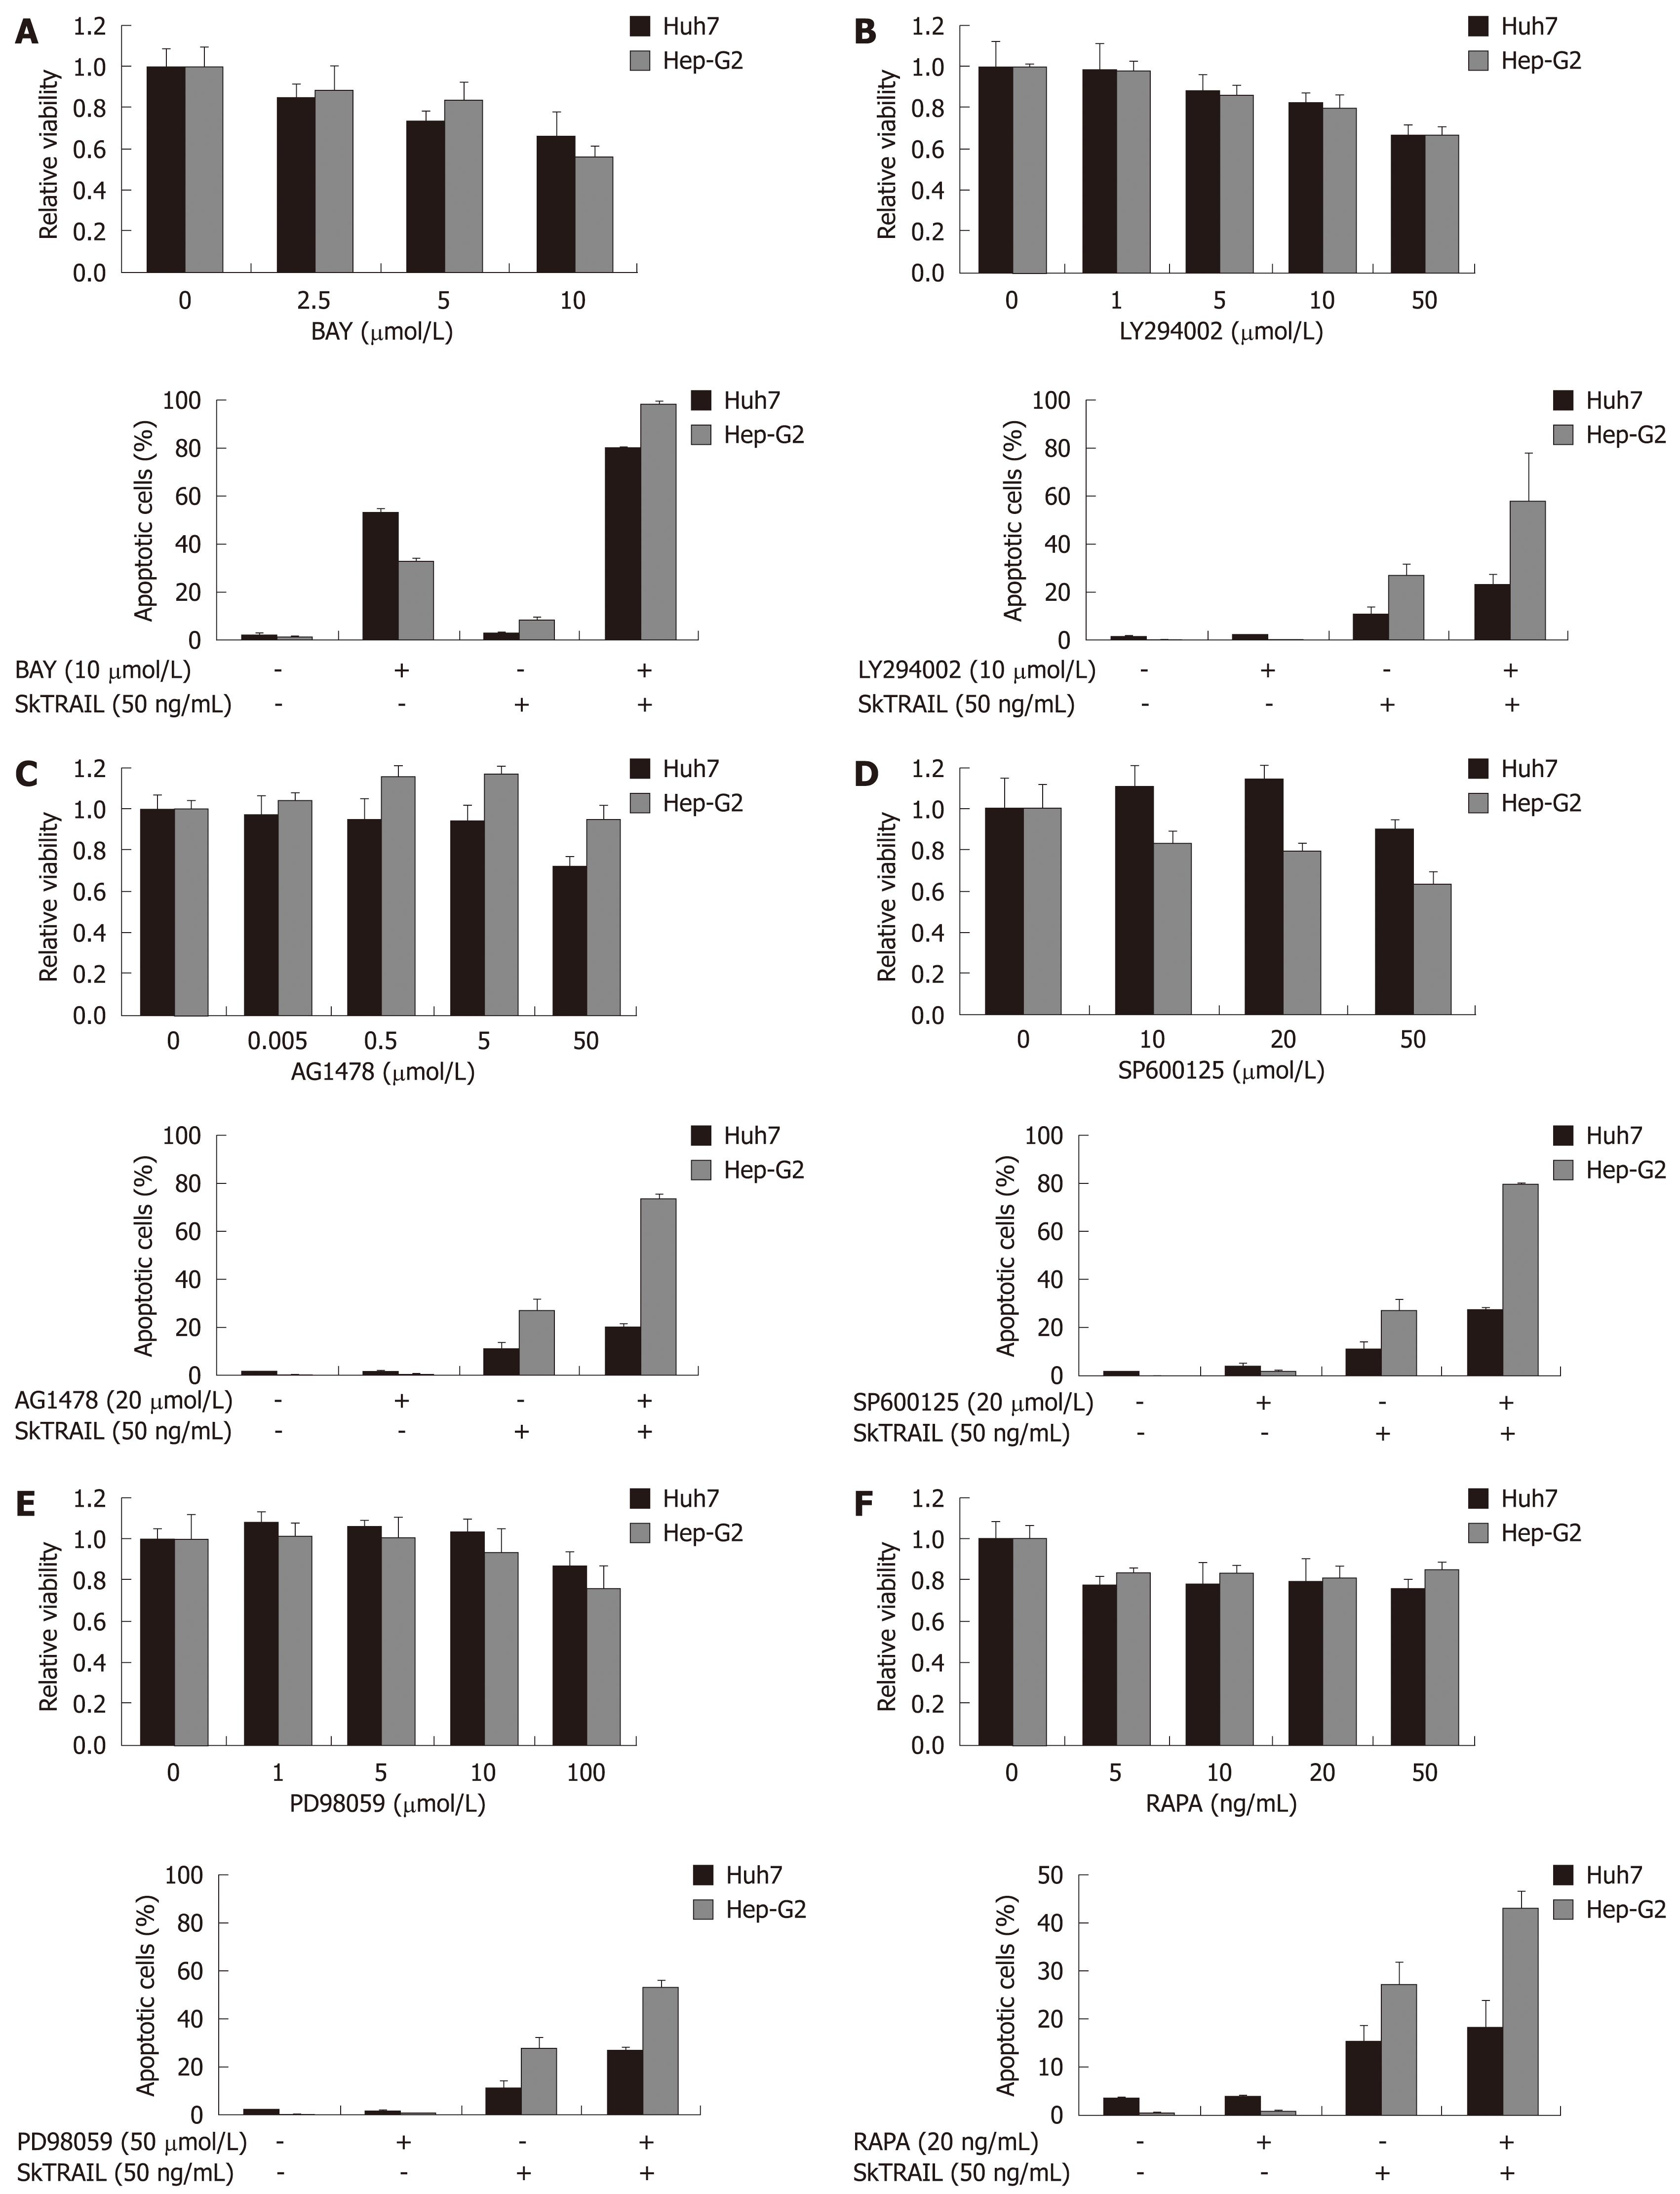
Figure 4 Treatment of HCC cells with TRAIL in combination with specific kinase inhibitors.
Viability of HCC cells treated with kinase inhibitors alone (upper panels). On day one after seeding of Huh7 and Hep-G2 cells onto 96-well plates, cells were treated with multi-kinase inhibitor Sorafenib (A), PI3 kinase inhibitor LY294002 (B), EGFR kinase inhibitor AG1478 (C), JNK inhibitor SP600125 (+ 0.2% DMSO as vehicle) (D), MEK inhibitor PD98059 (E) and mTOR inhibitor rapamycin (RAPA) (F) at the indicated concentrations for 48 h. Cell viability was analyzed by MTT assay. Viability is shown relative to untreated or 0.2% DMSO treated controls, respectively. Assays were performed in six-fold values. Values are expressed as mean ± SD. Apoptosis induction in Huh7 and Hep-G2 cells treated with 10 μmol/L Sorafenib (A), 10 μmol/L LY294002 (B), 20 μmol/L AG1478(C), 20 μmol/L SP600125 (+ 0.2% DMSO as vehicle) (D), 50 μmol/L PD98059 (E) and 20 ng/mL rapamycin (F) in combination with 50 ng/mL SkTRAIL (lower panels). Cells were seeded 1 d before treatment onto 12-well plates, harvested 48 h after treatment and analyzed for apoptosis induction by flow cytometry. Assays were performed in triplicate and are representative of at least two independent experiments. Values are expressed as mean ± SD.
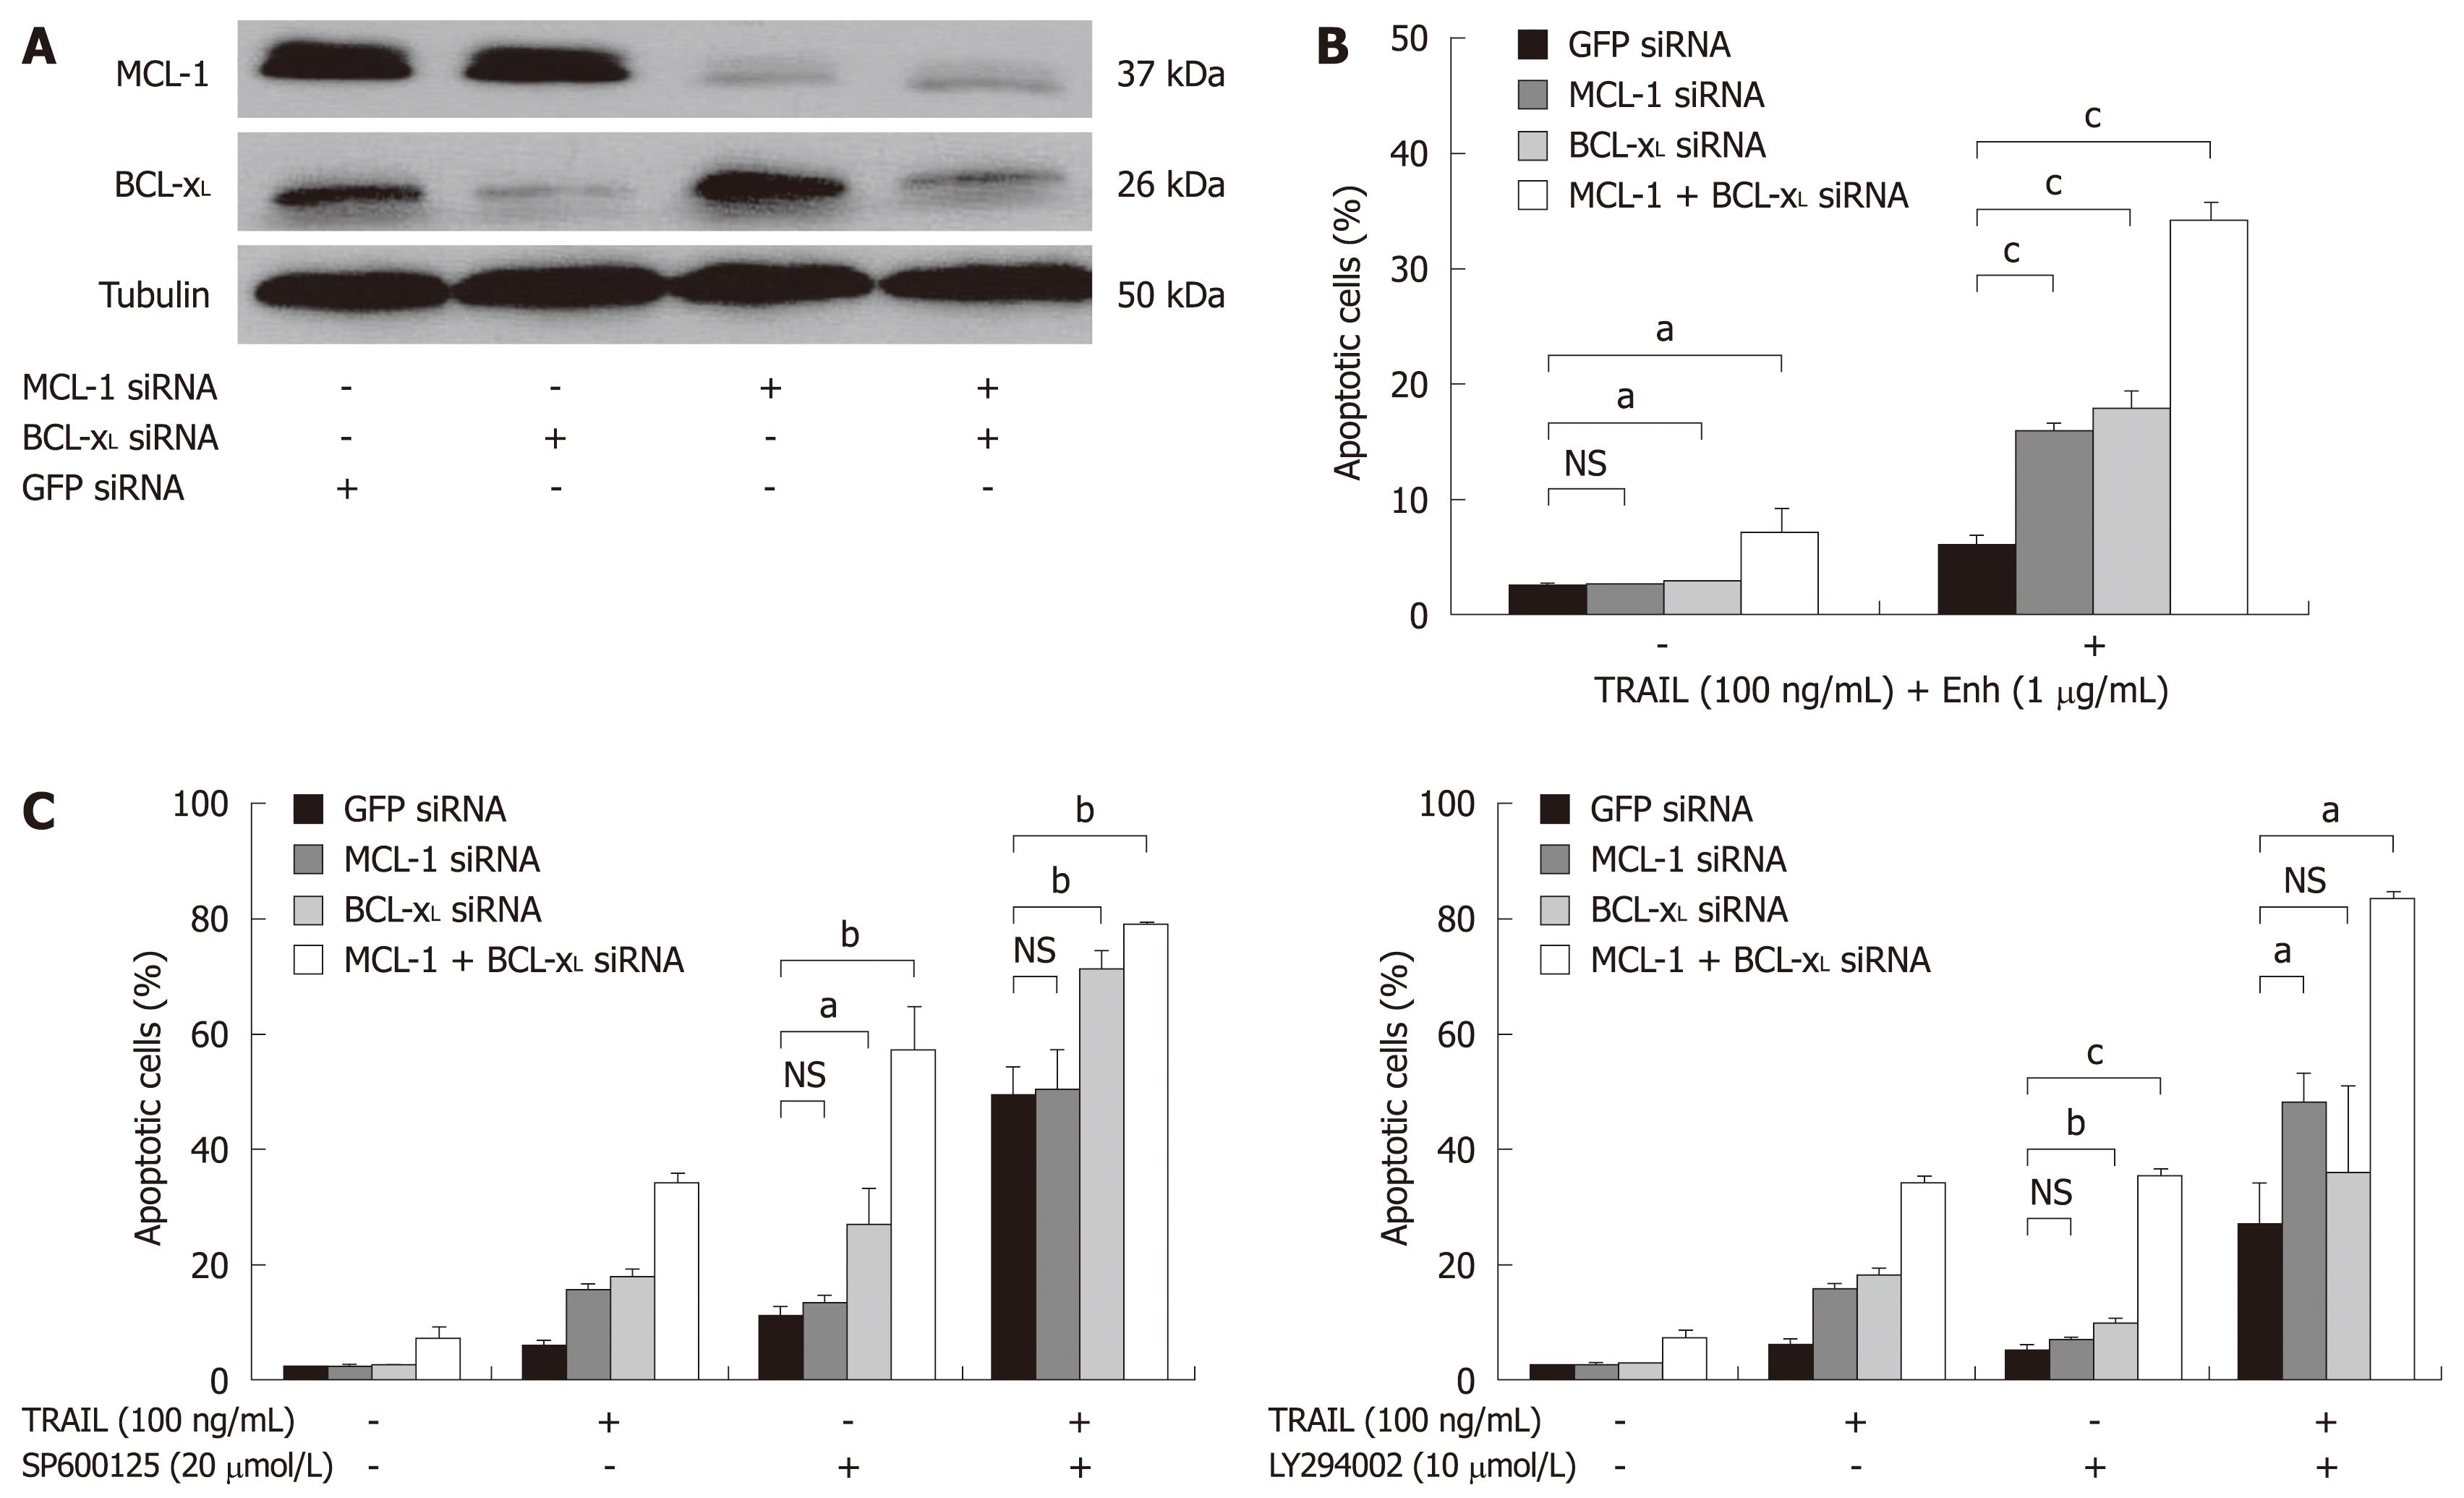
Figure 5 TRAIL-induced apoptosis in Huh7 cells after targeted therapy approaches and knock-down of BCL-xL and MCL-1.
A: Huh7 cells were transfected with siRNAs (40 nmol/L) specific for MCL-1 and BCL-xL either alone or in combination. SiGFP was used as control. Whole cell lysates were prepared 24 h after transfection. MCL-1 and BCL-xL expression was analyzed by Western blotting. α-Tubulin expression was used to control equal loading; B: 24 h after siRNA transfection, cells were treated for 48 h with 100 ng/mL TRAIL (+ 1 μg/mL Enhancer); C: 20 μmol/L SP600125 (left panel) or 10 μmol/L LY294002 (+ 0.2% DMSO as vehicle, right panel), either alone or in combination with 100 ng/mL TRAIL (+ 1 μg/mL Enhancer). Cells were harvested on day two after treatment and analyzed for apoptosis induction by flow cytometry. Assays were performed in triplicate and are representative of at least two independent experiments. Values are expressed as mean ± SD. NS: Not significant. aP < 0.05, bP < 0.01, cP < 0.001.
- Citation: Koehler BC, Urbanik T, Vick B, Boger RJ, Heeger S, Galle PR, Schuchmann M, Schulze-Bergkamen H. TRAIL-induced apoptosis of hepatocellular carcinoma cells is augmented by targeted therapies. World J Gastroenterol 2009; 15(47): 5924-5935
- URL: https://www.wjgnet.com/1007-9327/full/v15/i47/5924.htm
- DOI: https://dx.doi.org/10.3748/wjg.15.5924


