Copyright
©2009 The WJG Press and Baishideng.
World J Gastroenterol. Dec 14, 2009; 15(46): 5805-5812
Published online Dec 14, 2009. doi: 10.3748/wjg.15.5805
Published online Dec 14, 2009. doi: 10.3748/wjg.15.5805
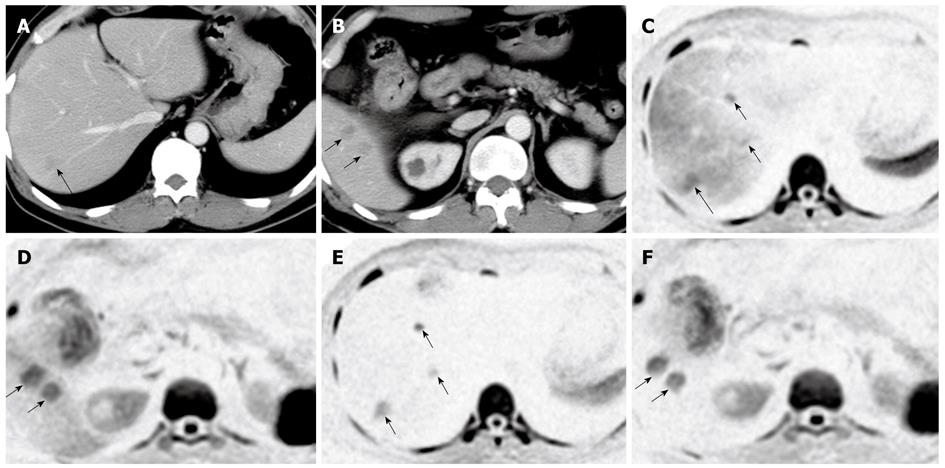
Figure 1 A case of hepatic metastases of colon cancer.
A, B: Dynamic computed tomography of the liver in the portal phase showing multiple metastatic lesions, which are indicated as low-density masses (arrows); C, D: Diffusion-weighted imaging (DWI) of the same locations as in (A) and (B), clearly showing metastatic lesions as high signal intensities; E, F: After SPIO administration, the background signal intensity of the liver parenchyma was reduced and the signal intensities of the metastatic lesions were seen more clearly.
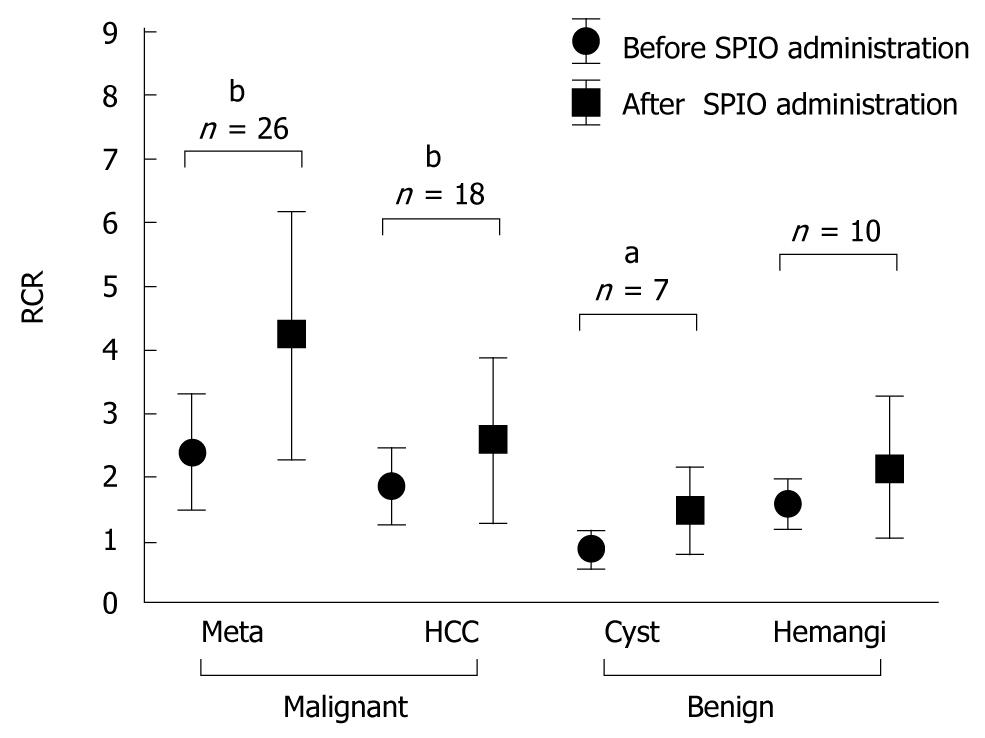
Figure 2 Relative contrast ratio (RCR) of focal hepatic lesions visualized by diffusion-weighted imaging (DWI) before and after the administration of superparamagnetic iron oxide (SPIO).
Meta: Metastatic liver cancer; HCC: Hepatocellular carcinoma; hemangi: Hepatic hemangioma. aP < 0.05, bP < 0.01.
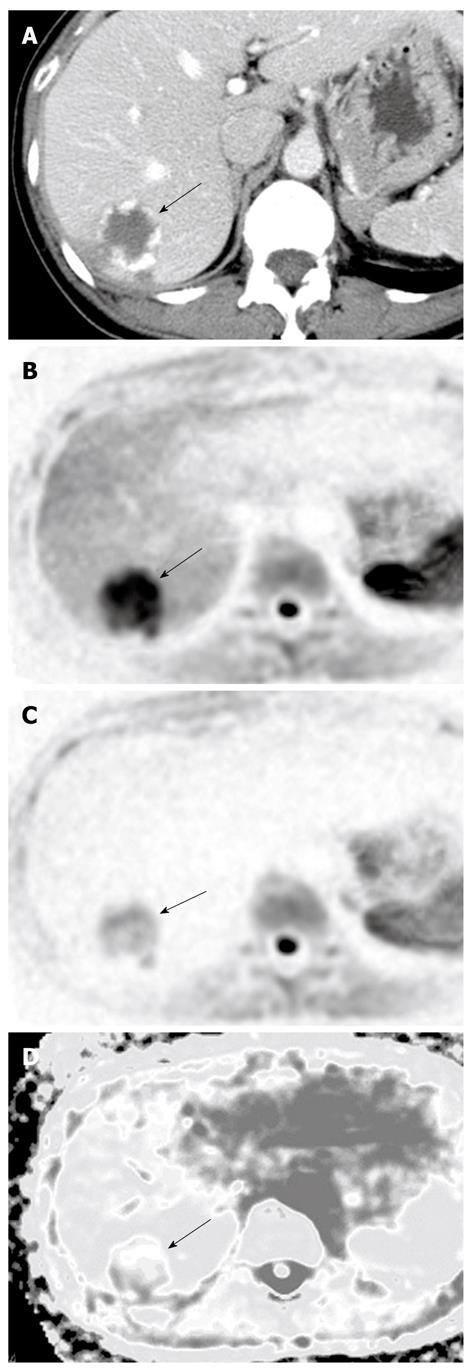
Figure 3 A case of hepatic hemangioma.
A: Dynamic computed tomography in the portal phase showing a low-density mass with a marginal stain at the S7 lobe (arrow). This is a typical staining pattern for hemangiomas; B: The hemangioma (arrow) expressed high signal intensity on diffusion-weighted imaging; C: The intensity of this signal was reduced after administration of superparamagnetic iron oxide (arrow); D: The hemangioma showed a high apparent diffusion coefficient (ADC) value on the ADC map (arrow).
Figure 4 A case of multiple hepatic metastases of colon cancer with multiple hepatic cysts.
A, B: T2-weighted magnetic resonance imaging showing high signal intensities on both metastatic lesions (arrows) and cysts (arrow heads); C, D: Diffusion-weighted imaging after administration of superparamagnetic iron oxide showing high signal intensities on metastatic lesions only (arrows).
Figure 5 Comparison of apparent diffusion coefficient (ADC) between focal hepatic lesions and surrounding hepatic parenchyma.
Meta: Metastatic liver cancer; HCC: Hepatocellular carcinoma; CC: Cholangiocarcinoma; Hemangi: Hepatic hemangioma. bP < 0.01.
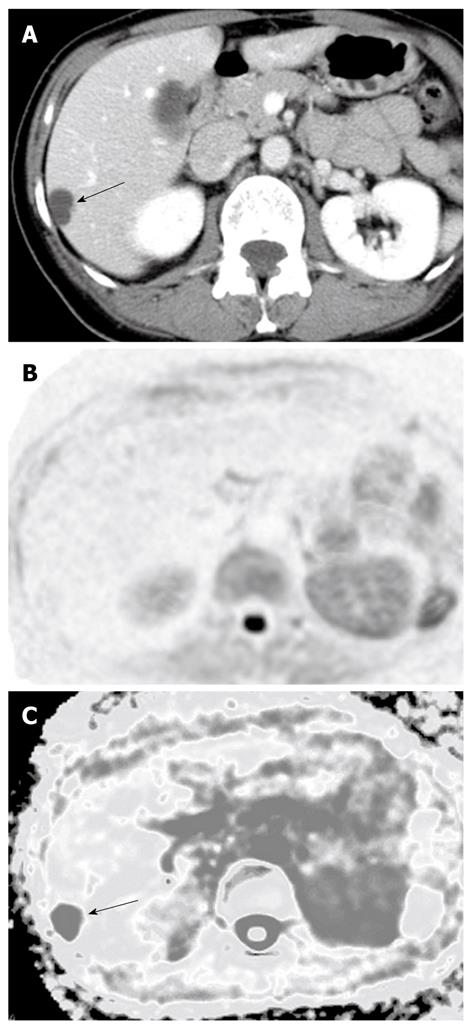
Figure 6 A case of hepatic cysts.
A: Dynamic computed tomography in the portal phase showing the hepatic cyst as a low-density lesion (arrow); B: The lesion expressed no signal intensity on diffusion-weighted imaging; C: The lesion showed a high apparent diffusion coefficient (ADC) on the ADC map (arrow).
- Citation: Koike N, Cho A, Nasu K, Seto K, Nagaya S, Ohshima Y, Ohkohchi N. Role of diffusion-weighted magnetic resonance imaging in the differential diagnosis of focal hepatic lesions. World J Gastroenterol 2009; 15(46): 5805-5812
- URL: https://www.wjgnet.com/1007-9327/full/v15/i46/5805.htm
- DOI: https://dx.doi.org/10.3748/wjg.15.5805


