Copyright
©2009 The WJG Press and Baishideng.
World J Gastroenterol. Nov 28, 2009; 15(44): 5620-5623
Published online Nov 28, 2009. doi: 10.3748/wjg.15.5620
Published online Nov 28, 2009. doi: 10.3748/wjg.15.5620
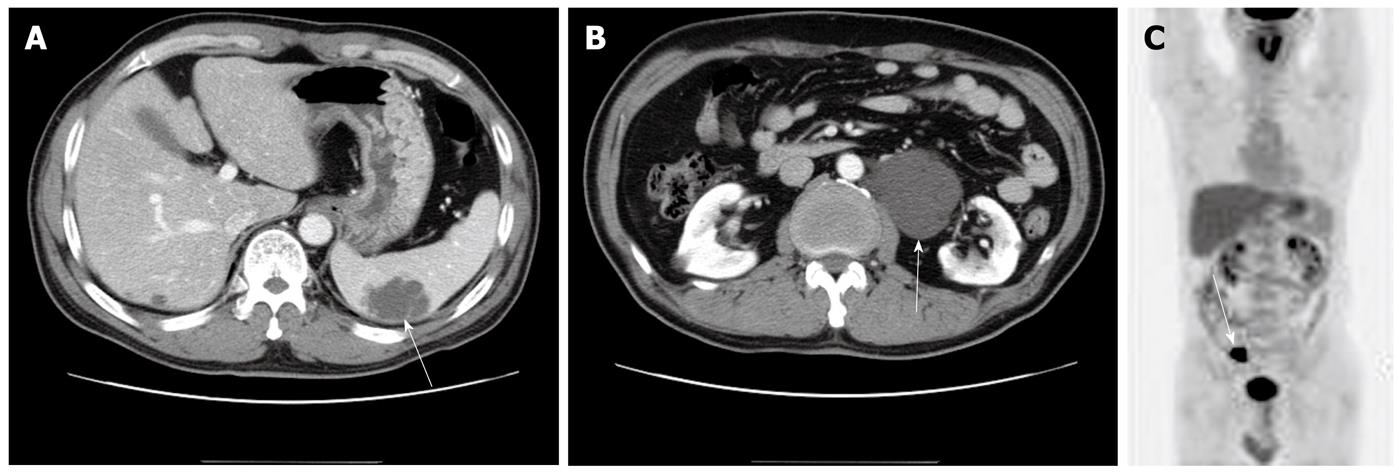
Figure 1 Enhanced abdominal CT and F-18 FDG Torso PET CT images of lymphangioma.
A: A 5.7 cm lobulated & septated mass without enhancement in the spleen (white arrow); B: A 10 cm lobulated cystic mass in the paraaortic area (white arrow); C: A hypermetabolic lesion in the sigmoid colon mass (white arrow) and maxSUV 23 but no hypermetabolic lesion in the spleen and retroperitoneum.
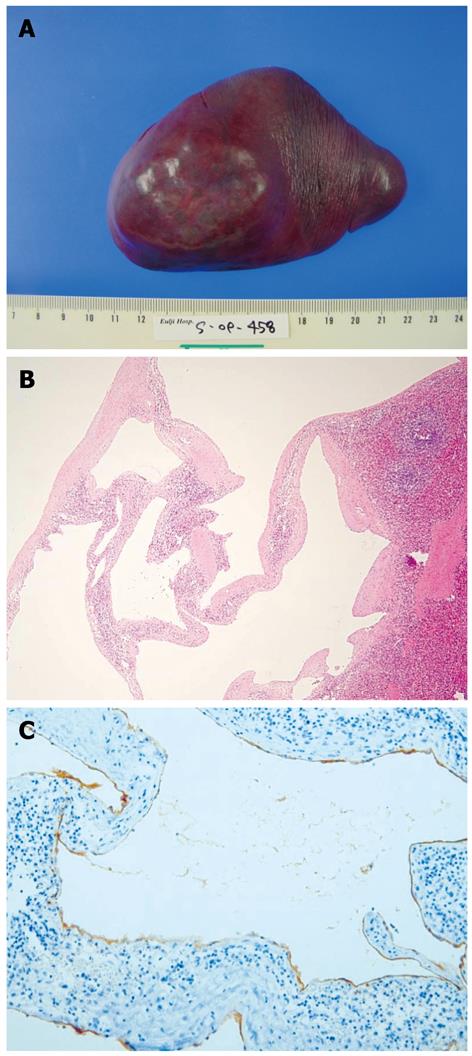
Figure 2 Gross and microscopic images of splenic lymphangioma.
A: A 4.5 cm × 3.5 cm bulging cystic mass in lower pole; B: HE staining of splenic lymphangioma, × 20; C: Immunostaining with D2-40 antibody (× 200) for cystic lining cells.
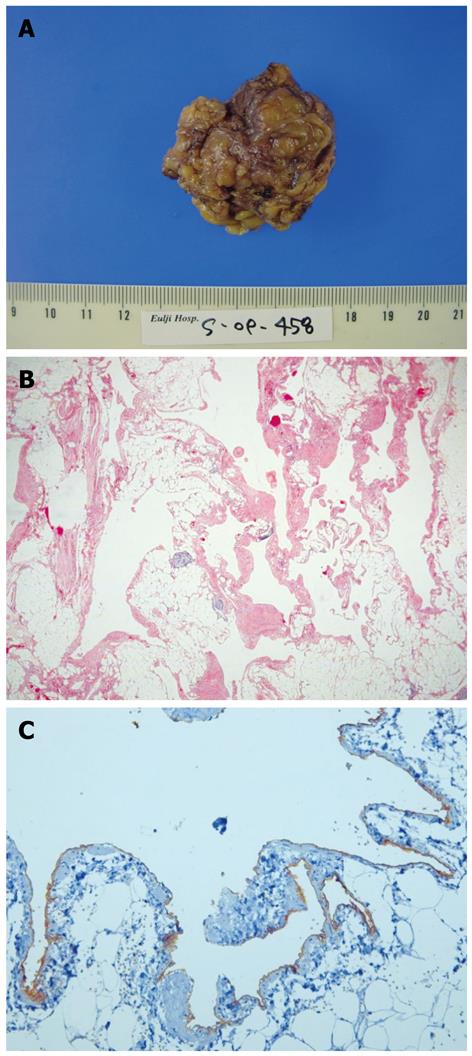
Figure 3 Gross and microscopic images of retroperitoneal lymphangioma.
A: A 4.5 cm × 4.5 cm × 2.5 cm retroperitoneal mass; B: HE staining of retroperitoneal lymphangioma, × 20; C: Immunostaining with D2-40 antibody (× 200) for cystic lining cells.
- Citation: Chung SH, Park YS, Jo YJ, Kim SH, Jun DW, Son BK, Jung JY, Baek DH, Kim DH, Jung YY, Lee WM. Asymptomatic lymphangioma involving the spleen and retroperitoneum in adults. World J Gastroenterol 2009; 15(44): 5620-5623
- URL: https://www.wjgnet.com/1007-9327/full/v15/i44/5620.htm
- DOI: https://dx.doi.org/10.3748/wjg.15.5620


