Copyright
©2009 The WJG Press and Baishideng.
World J Gastroenterol. Nov 14, 2009; 15(42): 5352-5359
Published online Nov 14, 2009. doi: 10.3748/wjg.15.5352
Published online Nov 14, 2009. doi: 10.3748/wjg.15.5352
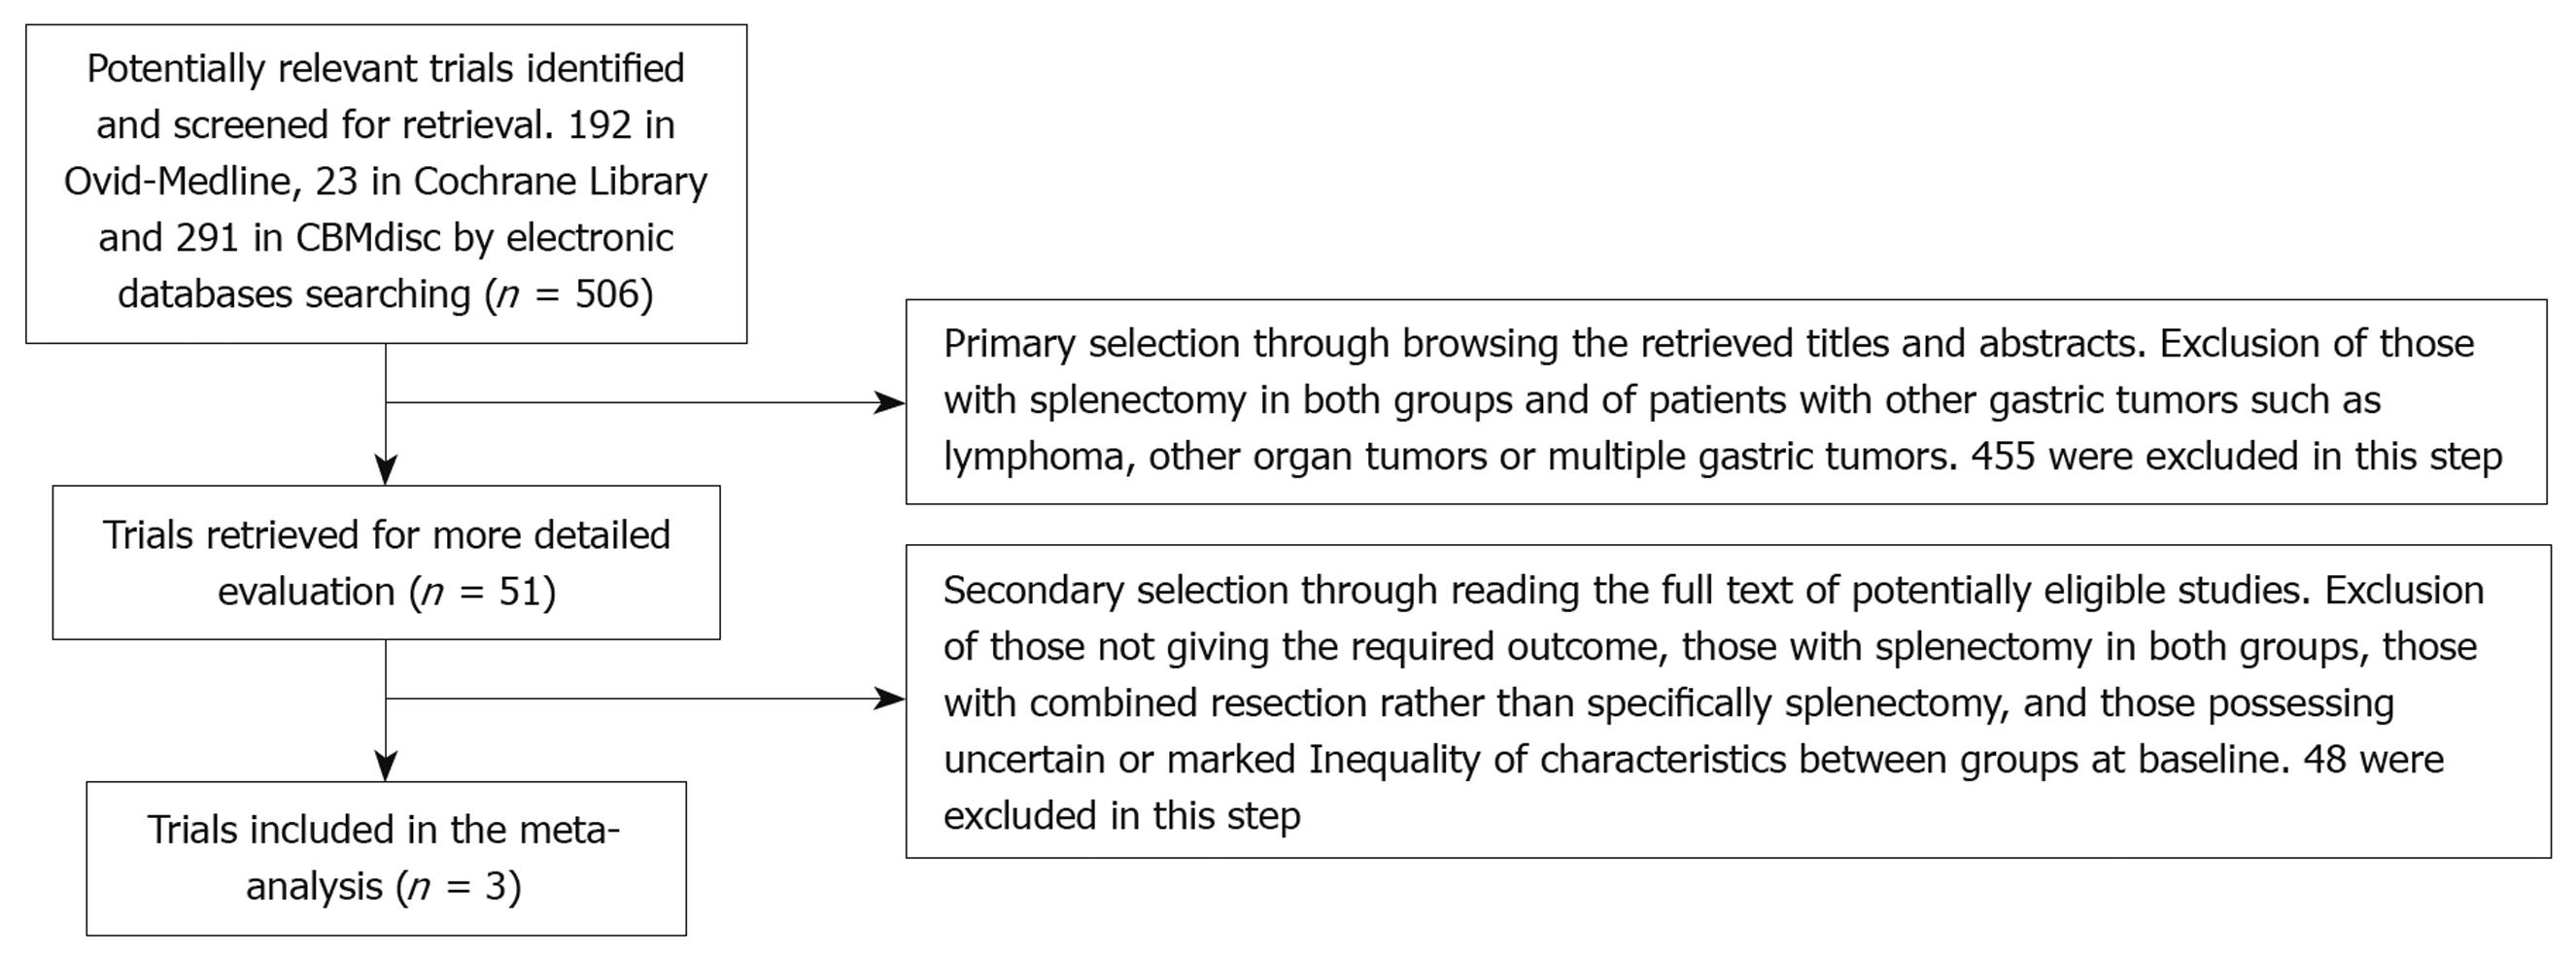
Figure 1 Flow chart showing study selection procedure.
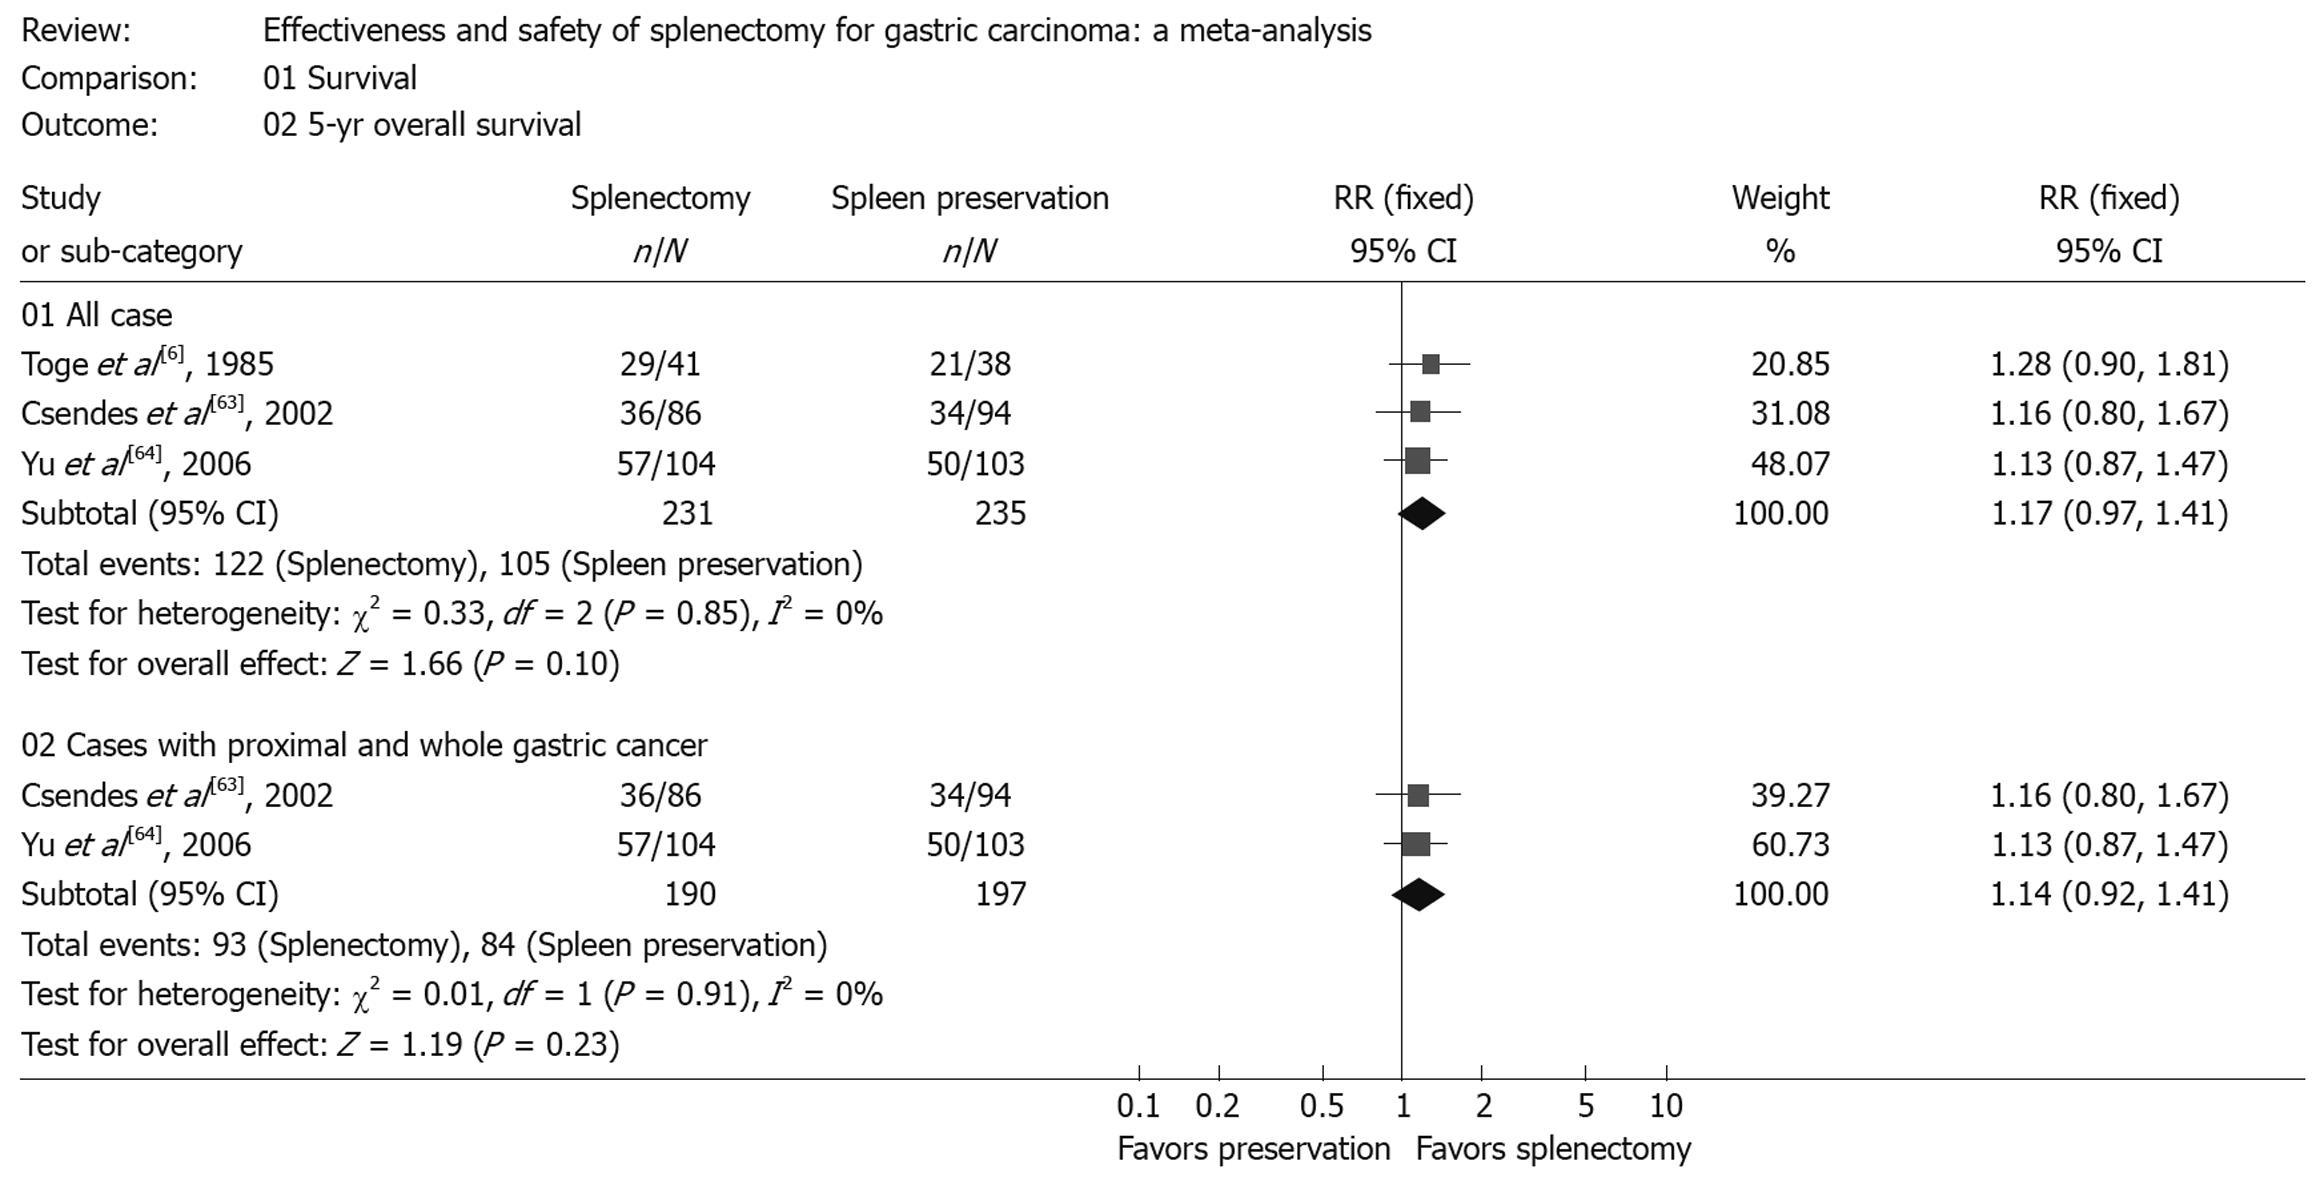
Figure 2 Survival rate.
Forest plot of RR of 5-year overall survival rate for all cases and cases with proximal and whole gastric carcinoma, with 95% CI. Data for a fixed-effects model are shown as there was no statistical heterogeneity.
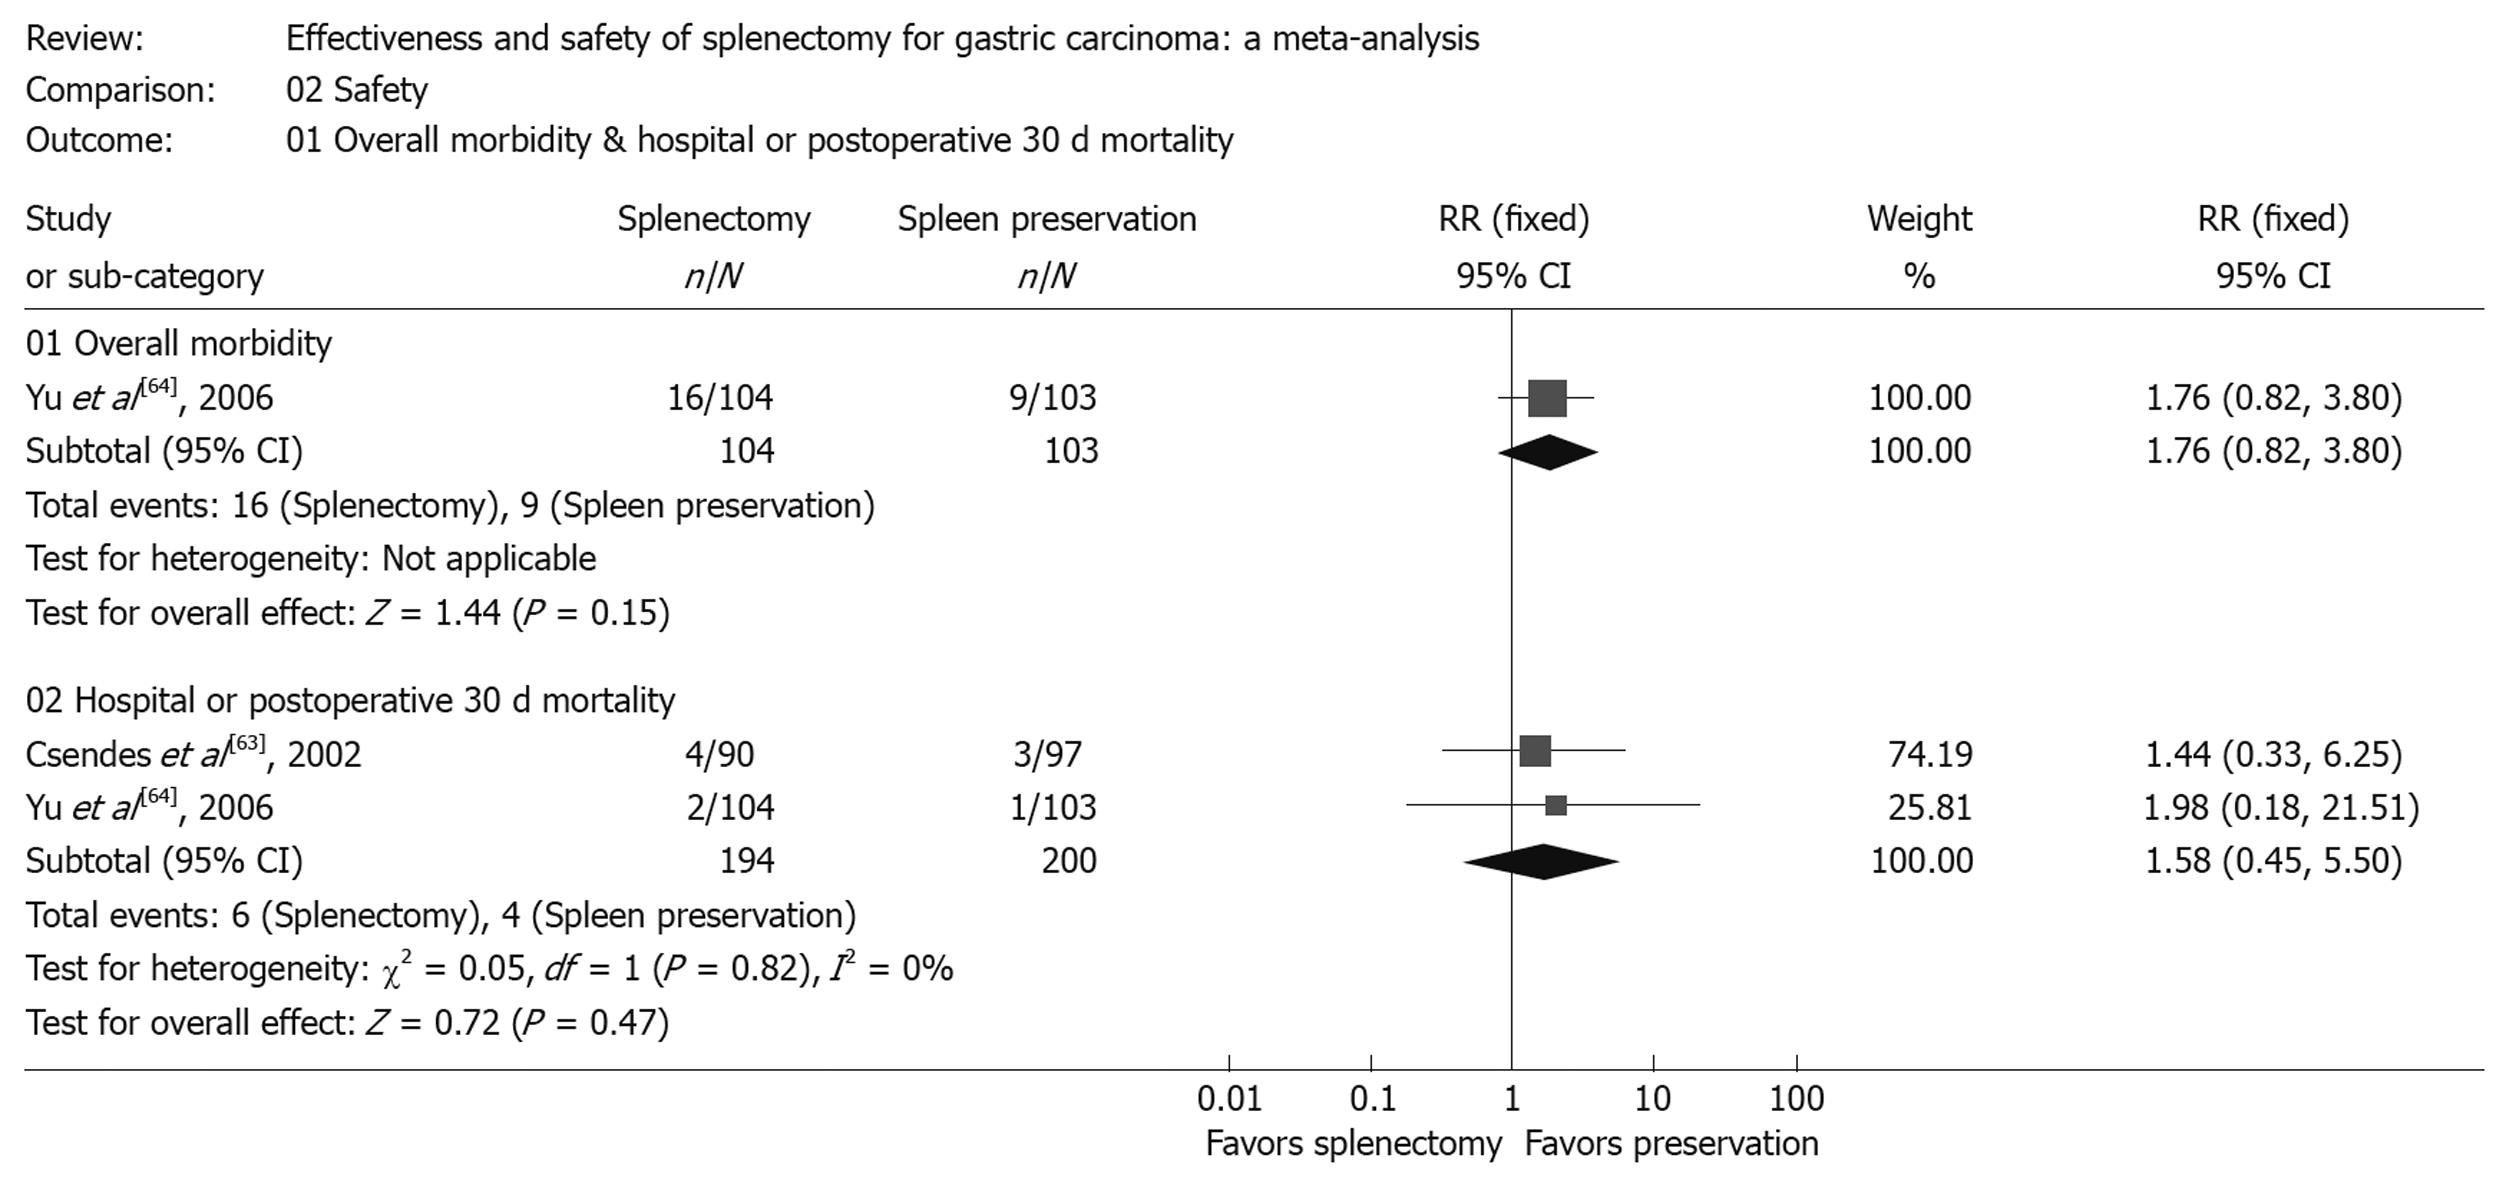
Figure 3 Morbidity and mortality.
Forest plot of RR of postoperative morbidity and mortality, with 95% CI. Data for a fixed-effects model are shown as there was no statistical heterogeneity.
- Citation: Yang K, Chen XZ, Hu JK, Zhang B, Chen ZX, Chen JP. Effectiveness and safety of splenectomy for gastric carcinoma: A meta-analysis. World J Gastroenterol 2009; 15(42): 5352-5359
- URL: https://www.wjgnet.com/1007-9327/full/v15/i42/5352.htm
- DOI: https://dx.doi.org/10.3748/wjg.15.5352


