Copyright
©2009 The WJG Press and Baishideng.
World J Gastroenterol. Nov 14, 2009; 15(42): 5287-5294
Published online Nov 14, 2009. doi: 10.3748/wjg.15.5287
Published online Nov 14, 2009. doi: 10.3748/wjg.15.5287
Figure 1 Relationships between endoscopic activity and total numbers of bacteria cultured from biopsies of UC patients and the control group.
Likelihood ratio = 9.535, P = 0.0490. UC: Ulcerative colitis.
Figure 2 Relationships between disease activity and numbers of Lactobacillus group of bacteria cultured from biopsies of CD patients and the control group.
Likelihood ratio = 13.209, P = 0.0398. CD: Crohn’s disease.
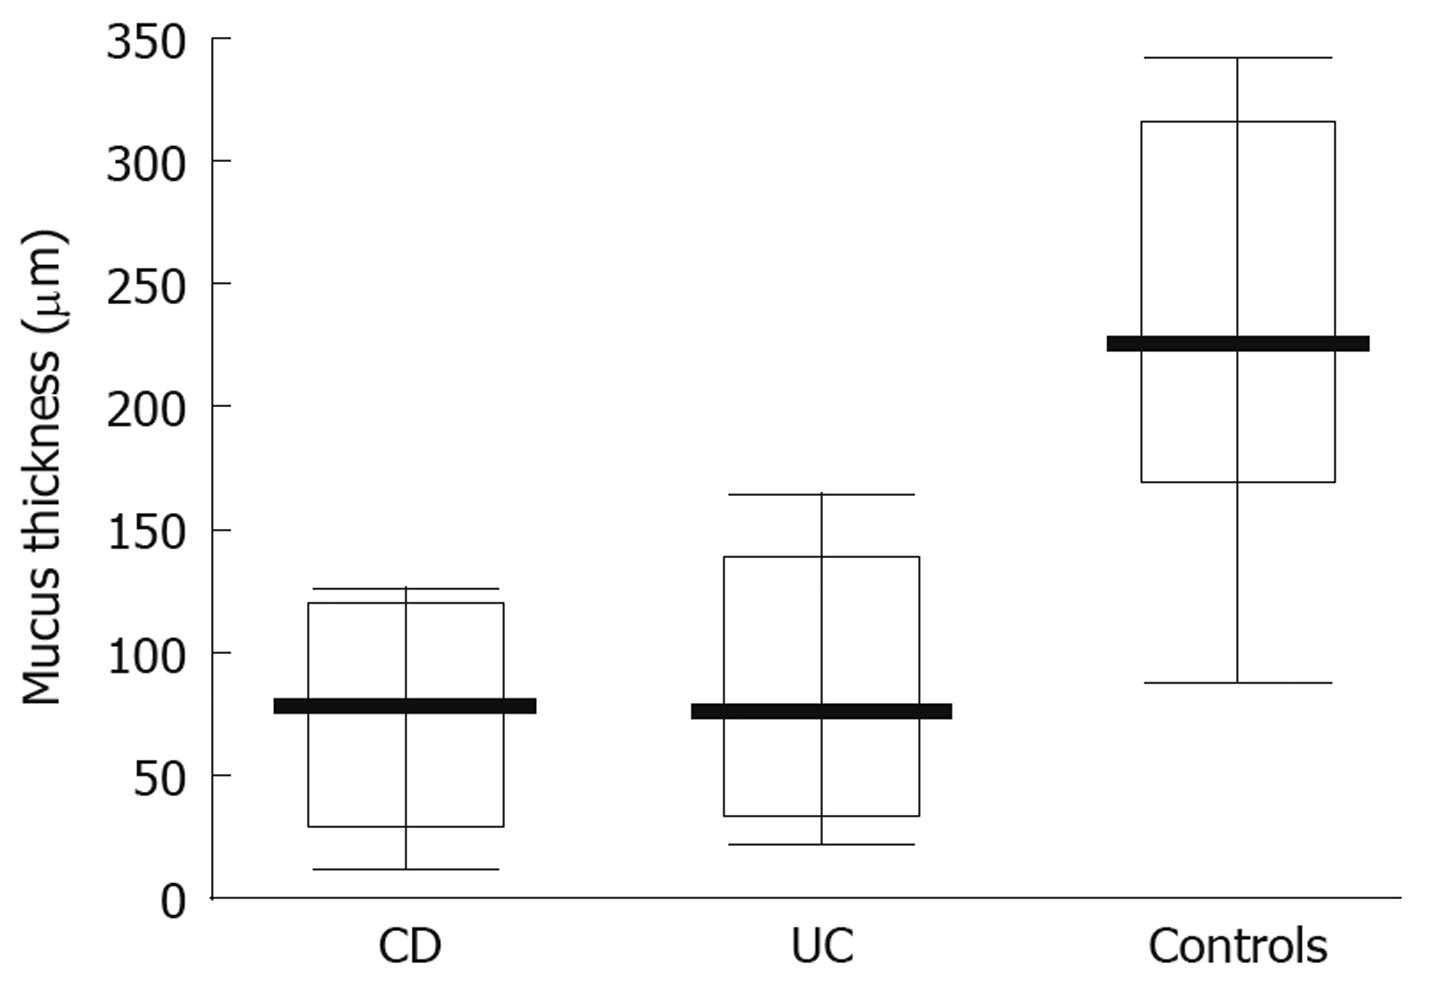
Figure 3 The average thickness of the mucus layer in biopsy samples obtained from inflamed areas in CD (H = 8.
0, P = 0.0047) and UC (H = 6.76, P = 0.0093) patients and controls. The horizontal line represents median value with 25% and 75% quartile.
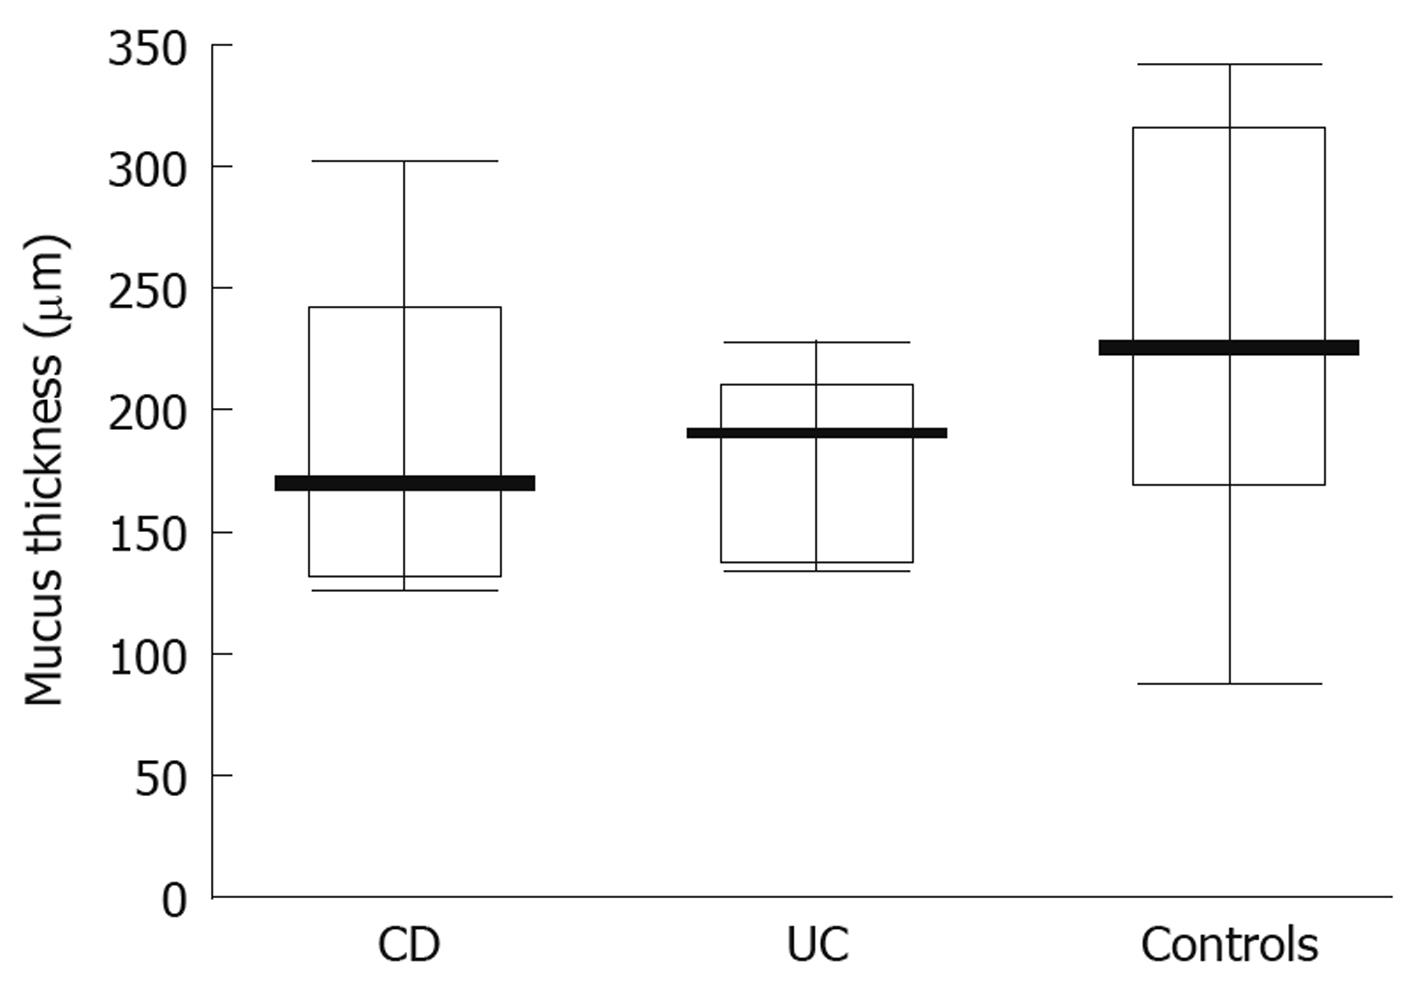
Figure 4 The average thickness of the mucus layer in biopsy samples obtained from non-inflamed areas in CD (H = 0.
1481, P = 0.7003) and UC (H = 0.987, P = 0.3137) patients and controls. The horizontal line represents median value with 25% and 75% quartile.
- Citation: Fyderek K, Strus M, Kowalska-Duplaga K, Gosiewski T, Wędrychowicz A, Jedynak-Wąsowicz U, Sładek M, Pieczarkowski S, Adamski P, Kochan P, Heczko PB. Mucosal bacterial microflora and mucus layer thickness in adolescents with inflammatory bowel disease. World J Gastroenterol 2009; 15(42): 5287-5294
- URL: https://www.wjgnet.com/1007-9327/full/v15/i42/5287.htm
- DOI: https://dx.doi.org/10.3748/wjg.15.5287


