Copyright
©2009 The WJG Press and Baishideng.
World J Gastroenterol. Nov 7, 2009; 15(41): 5228-5231
Published online Nov 7, 2009. doi: 10.3748/wjg.15.5228
Published online Nov 7, 2009. doi: 10.3748/wjg.15.5228
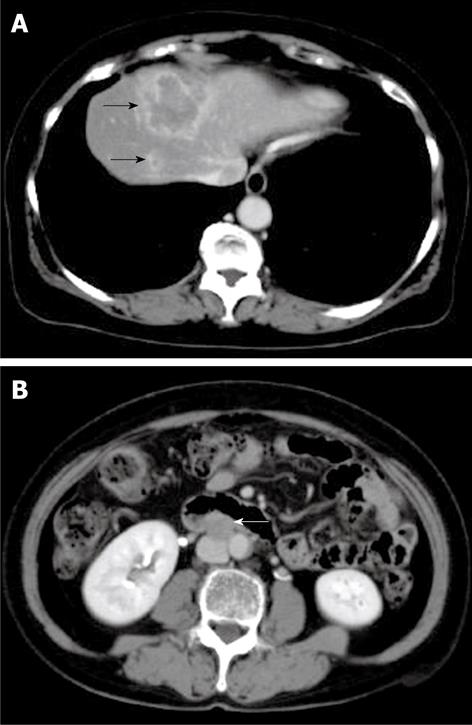
Figure 1 Computed tomography (CT) of the tumor on first admission.
CT shows a low-density lesion with rim enhancement in segment VIII of the liver (black arrows) (A) and enlarged lymph node in the para-aorta (white arrow) (B).
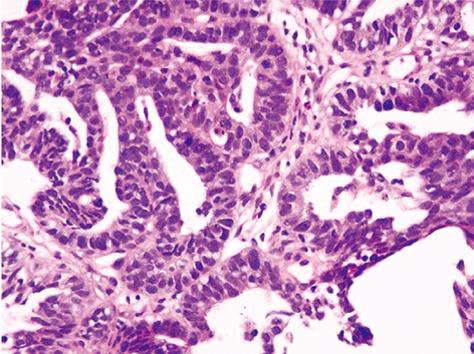
Figure 2 Hematoxylin-eosin staining.
Cuboidal cancer cells with chromatin-rich nuclei had proliferated invasively, forming indistinct glandular structures.
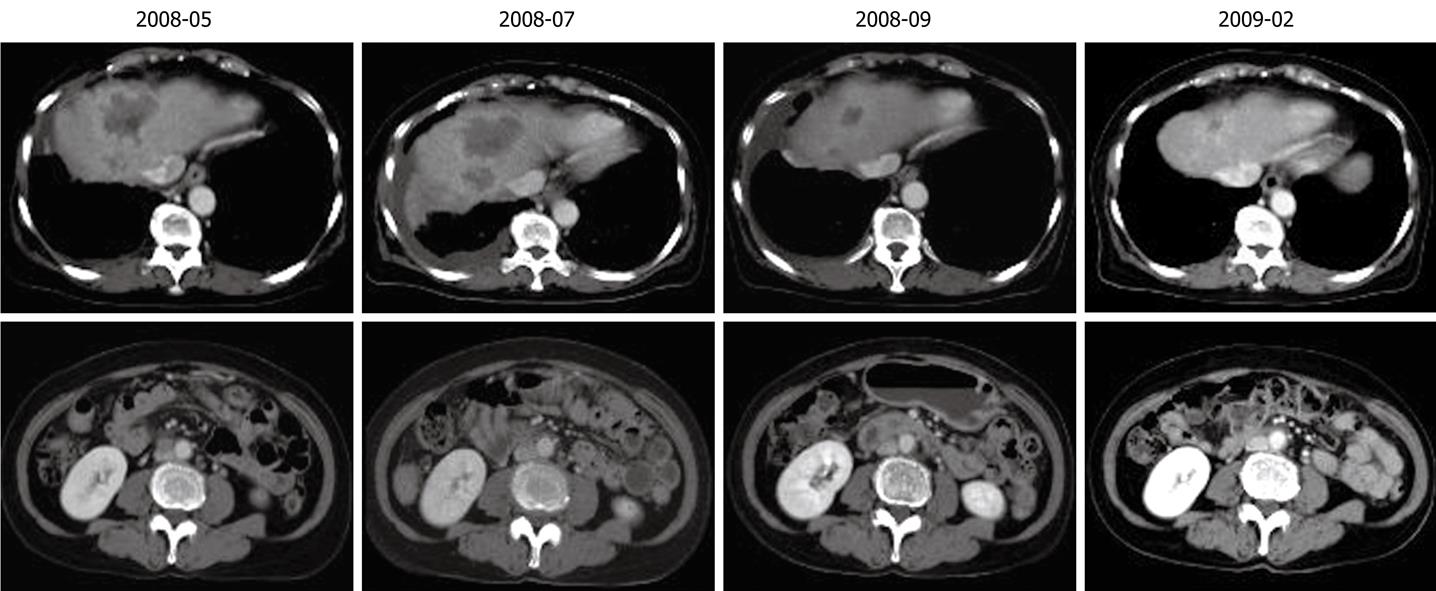
Figure 3 Reduction in tumors in the liver and lymph node following chemotherapy.
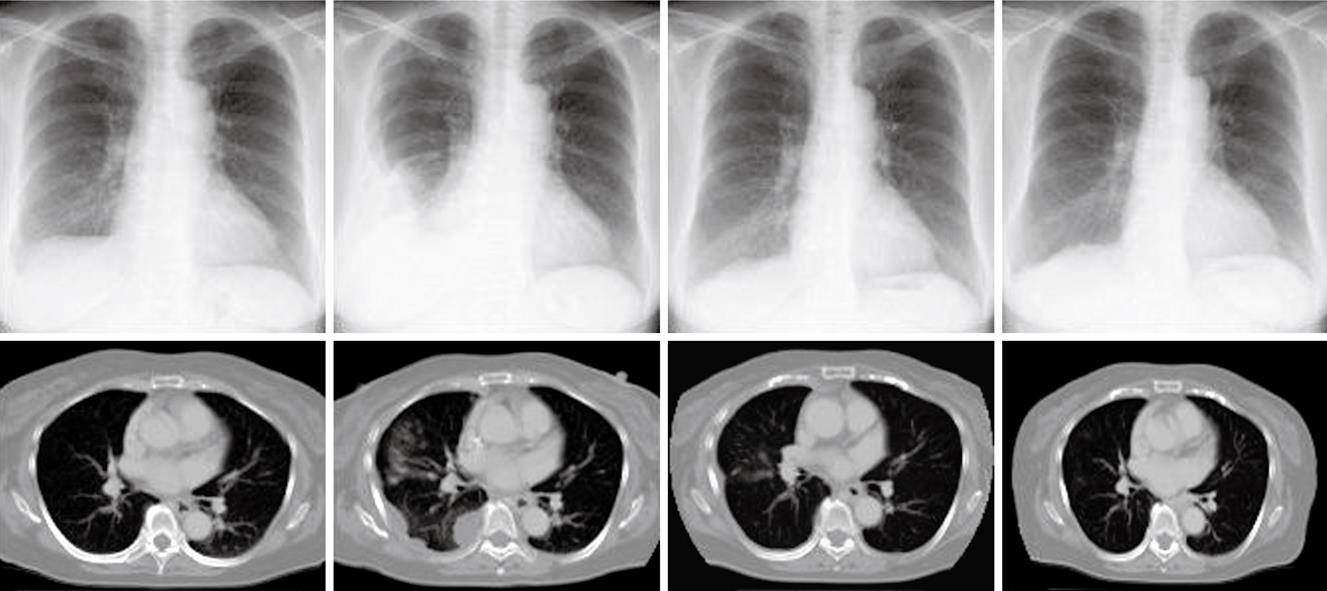
Figure 4 Decreased pleural metastases following chemotherapy.
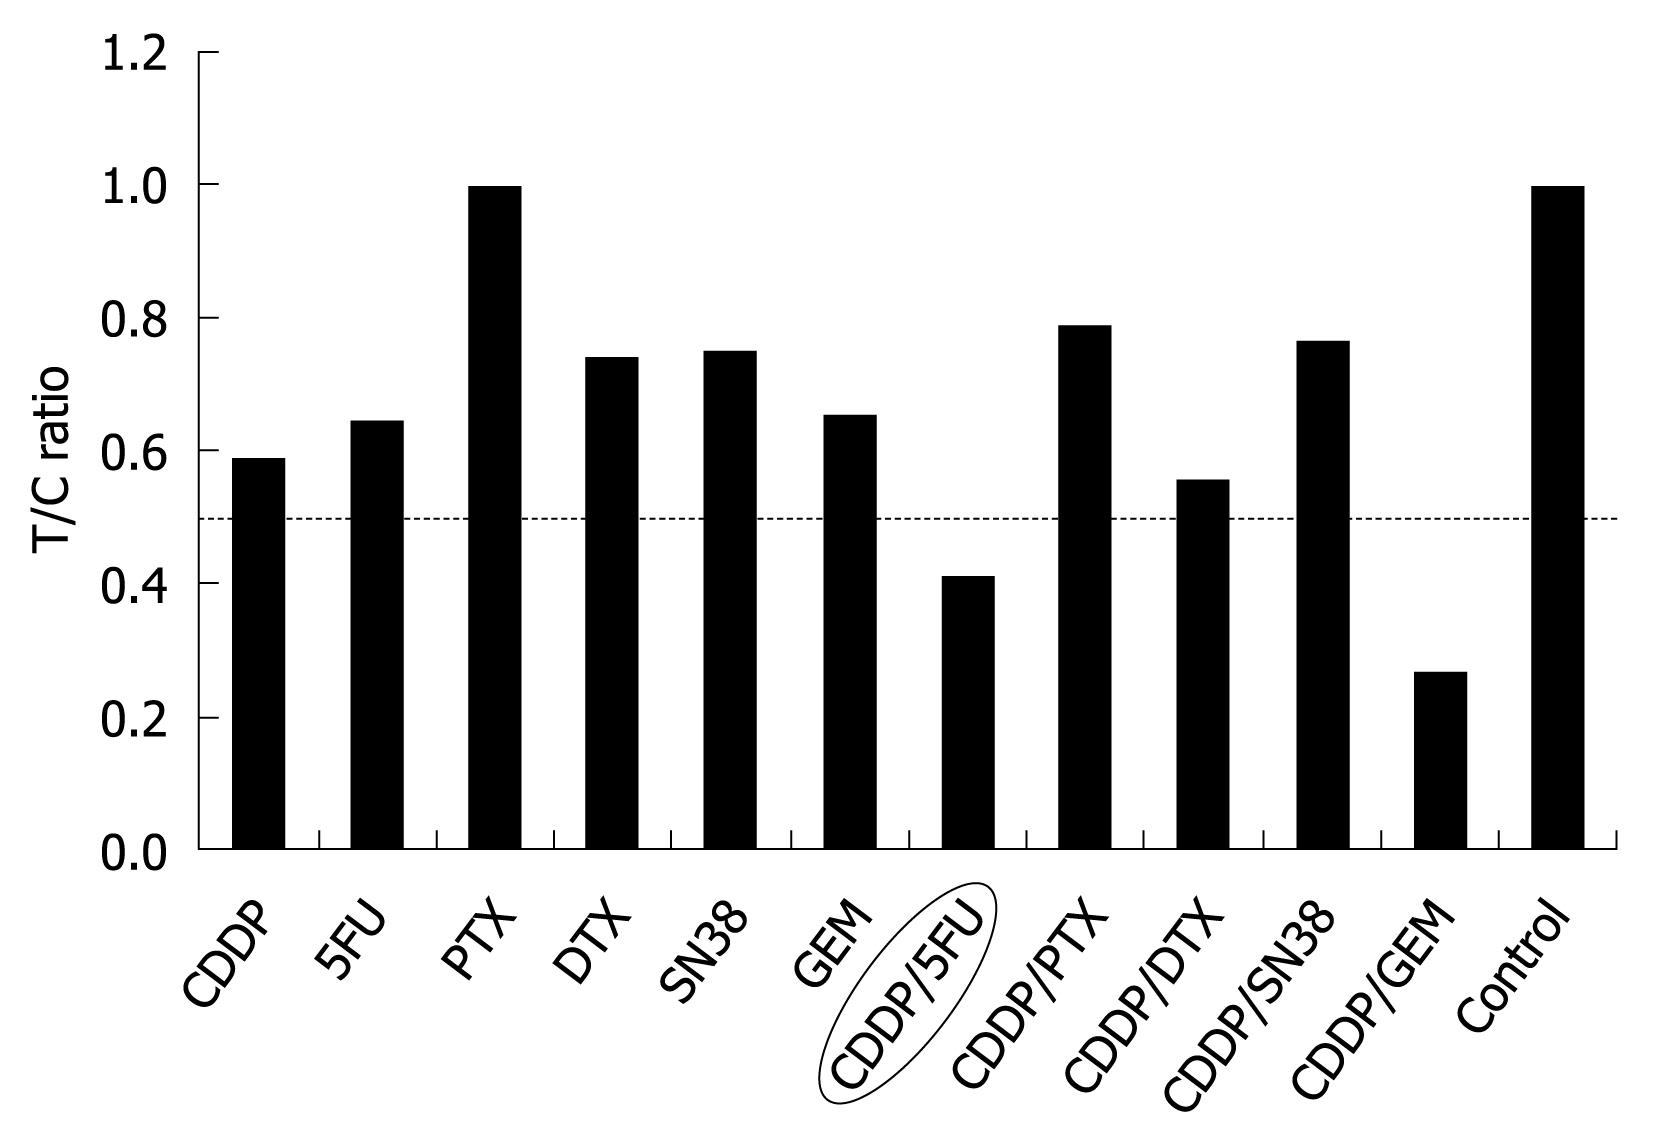
Figure 5 Cell viability evaluated by measuring the intracellular ATP level using bioluminescence.
The T/C (treated/control) ratio, or the ratio of ATP quantity of a tumor sample treated with anticancer drugs to that of the control, was used as the index of chemosensitivity.
- Citation: Abe K, Wakatsuki T, Katsushima F, Monoe K, Kanno Y, Takahashi A, Yokokawa J, Ohira H. A case of advanced intrahepatic cholangiocarcinoma successfully treated with chemosensitivity test-guided systemic chemotherapy. World J Gastroenterol 2009; 15(41): 5228-5231
- URL: https://www.wjgnet.com/1007-9327/full/v15/i41/5228.htm
- DOI: https://dx.doi.org/10.3748/wjg.15.5228


