Copyright
©2009 The WJG Press and Baishideng.
World J Gastroenterol. Nov 7, 2009; 15(41): 5186-5192
Published online Nov 7, 2009. doi: 10.3748/wjg.15.5186
Published online Nov 7, 2009. doi: 10.3748/wjg.15.5186
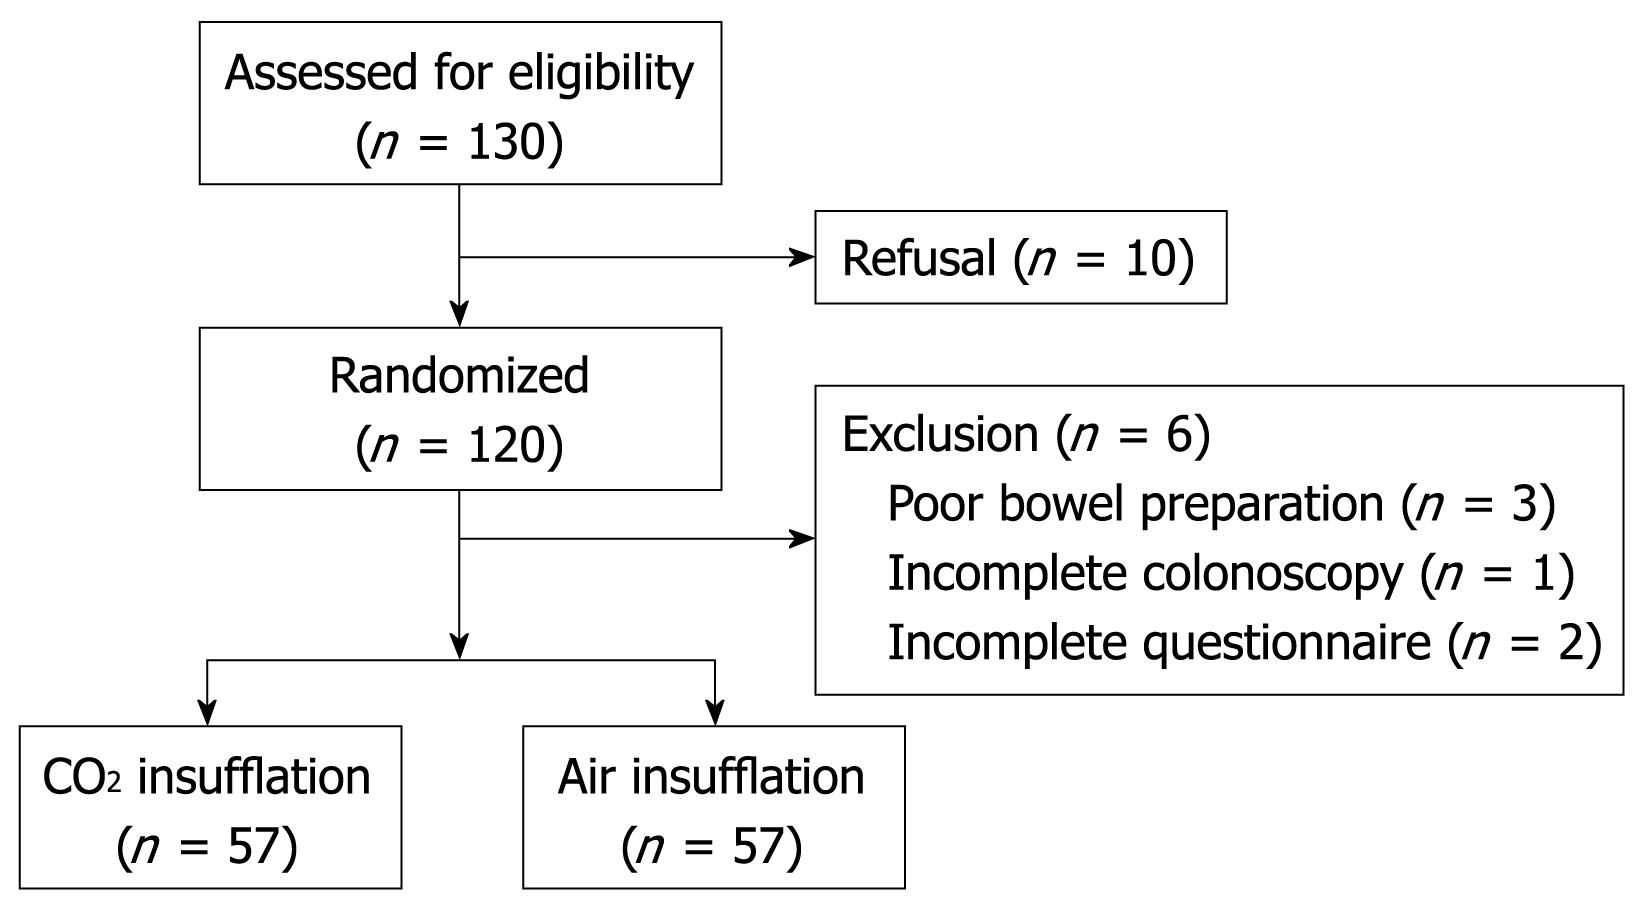
Figure 1 Patient flow chart.
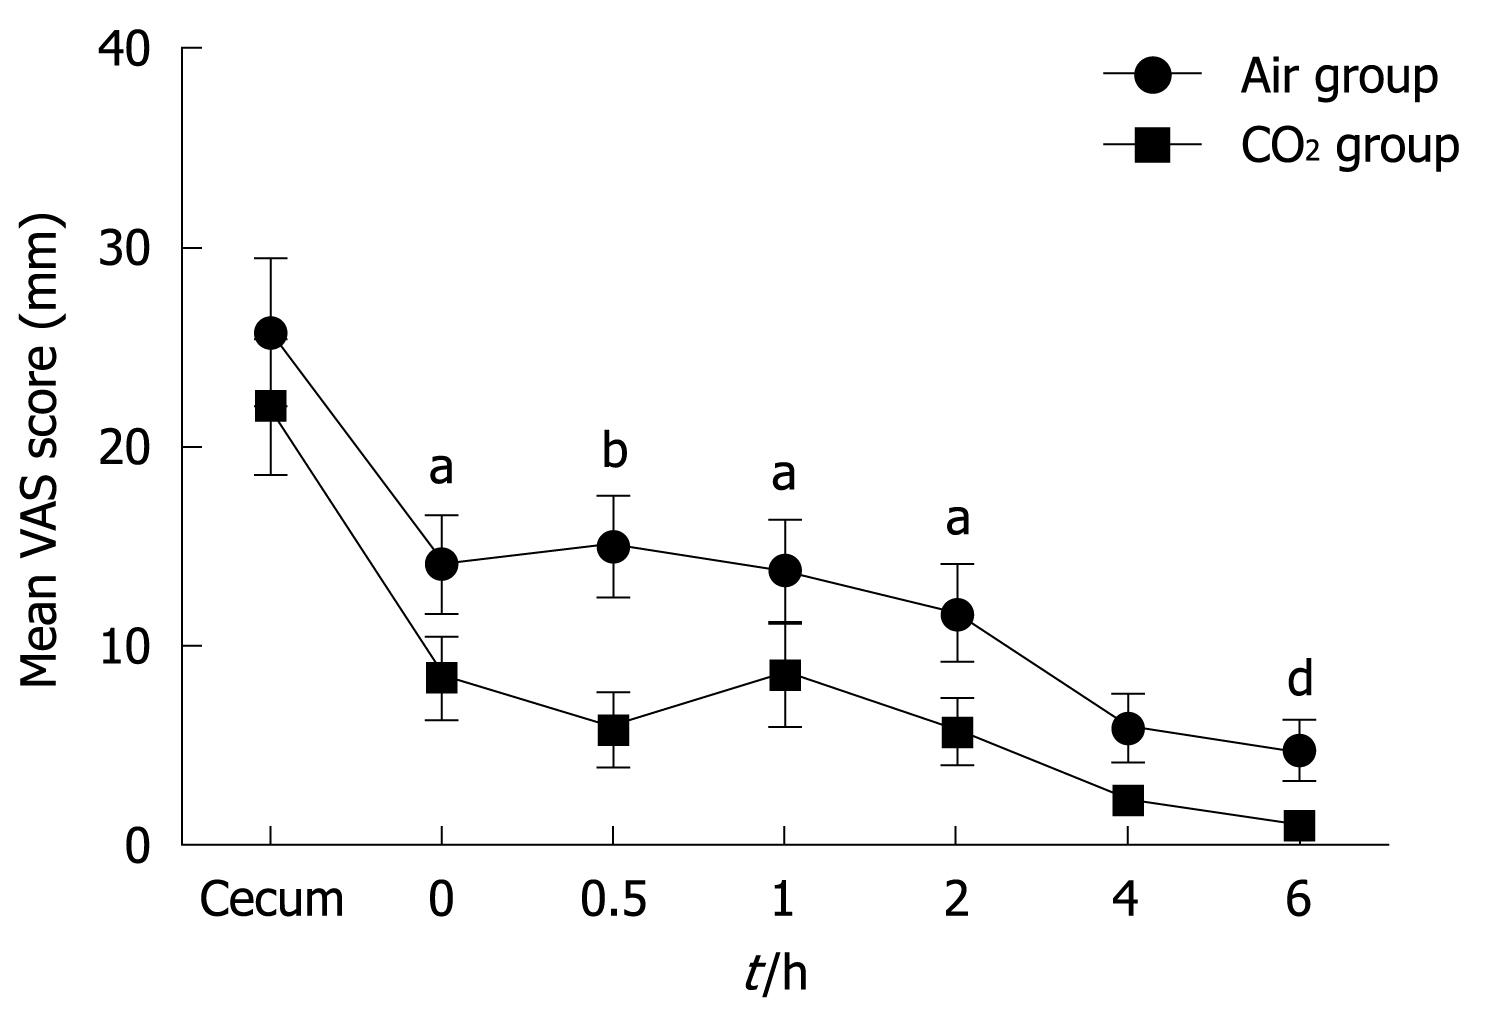
Figure 2 Mean VAS scores at corresponding measurement points during and after colonoscopy examinations in CO2 and air insufflation groups.
VAS scores for CO2 insufflation were significantly better than those for air insufflation (dP < 0.001, ANOVA for repeated measures). aP < 0.05, bP < 0.01 vs the CO2 group at each measurement point by Wilcoxon rank sum test. VAS: Visual analogue scale.
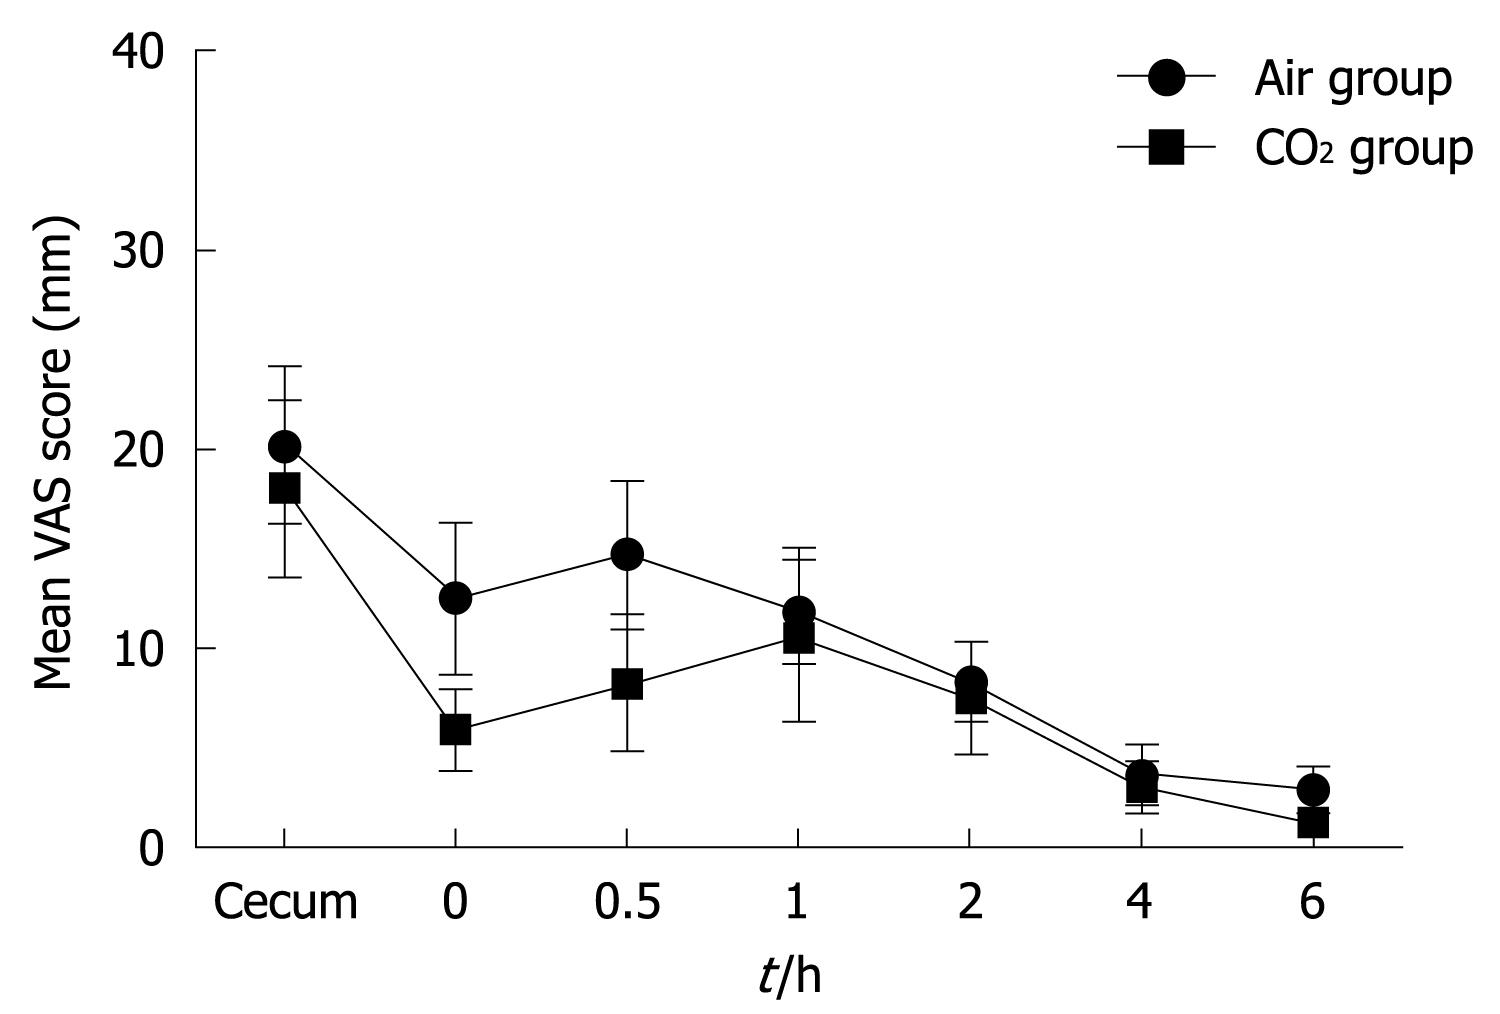
Figure 3 Mean VAS scores at corresponding measurement points during and after colonoscopy examinations for experienced colonoscopists (EC group) in CO2 and air insufflation groups.
There were no significant differences in VAS scores between the two insufflation groups for EC group (P = 0.29, ANOVA for repeated measures).
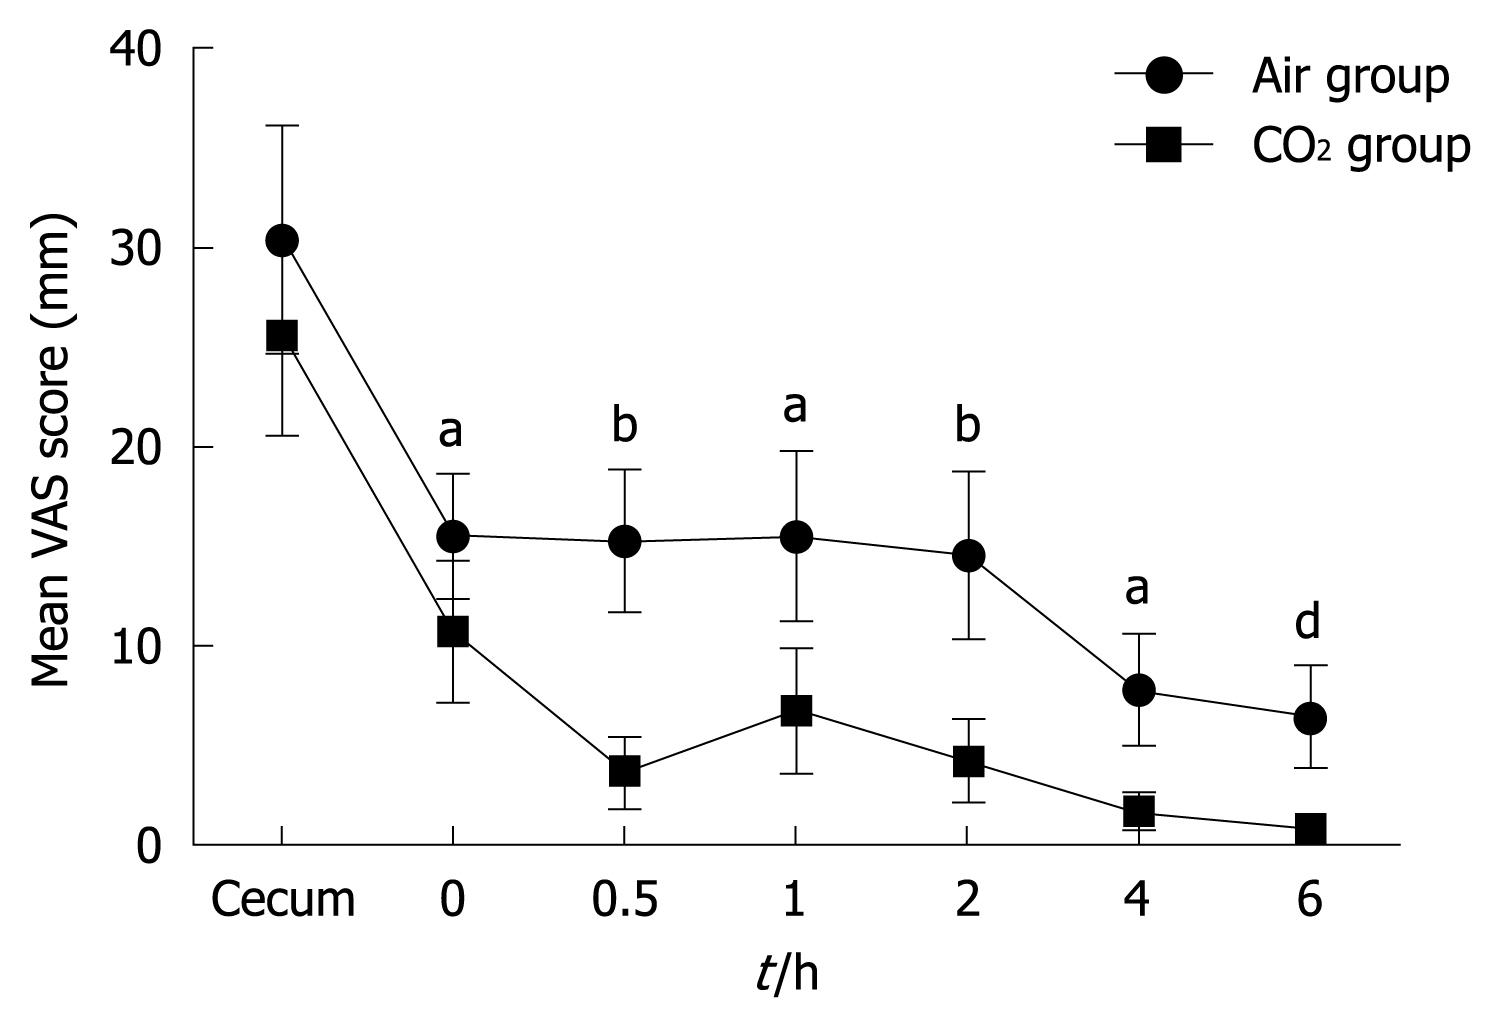
Figure 4 Mean VAS scores at corresponding measurement points during and after colonoscopy examinations for less experienced colonoscopists (LEC group) in CO2 and air insufflation groups.
VAS scores for CO2 insufflation were significantly better compared to air insufflation for LEC group (dP = 0.023, ANOVA for repeated measures). aP < 0.05, bP < 0.01 vs the CO2 group at each measurement point by Wilcoxon rank sum test.
- Citation: Uraoka T, Kato J, Kuriyama M, Hori K, Ishikawa S, Harada K, Takemoto K, Hiraoka S, Fujita H, Horii J, Saito Y, Yamamoto K. CO2 insufflation for potentially difficult colonoscopies: Efficacy when used by less experienced colonoscopists. World J Gastroenterol 2009; 15(41): 5186-5192
- URL: https://www.wjgnet.com/1007-9327/full/v15/i41/5186.htm
- DOI: https://dx.doi.org/10.3748/wjg.15.5186


