Copyright
©2009 The WJG Press and Baishideng.
World J Gastroenterol. Nov 7, 2009; 15(41): 5181-5185
Published online Nov 7, 2009. doi: 10.3748/wjg.15.5181
Published online Nov 7, 2009. doi: 10.3748/wjg.15.5181
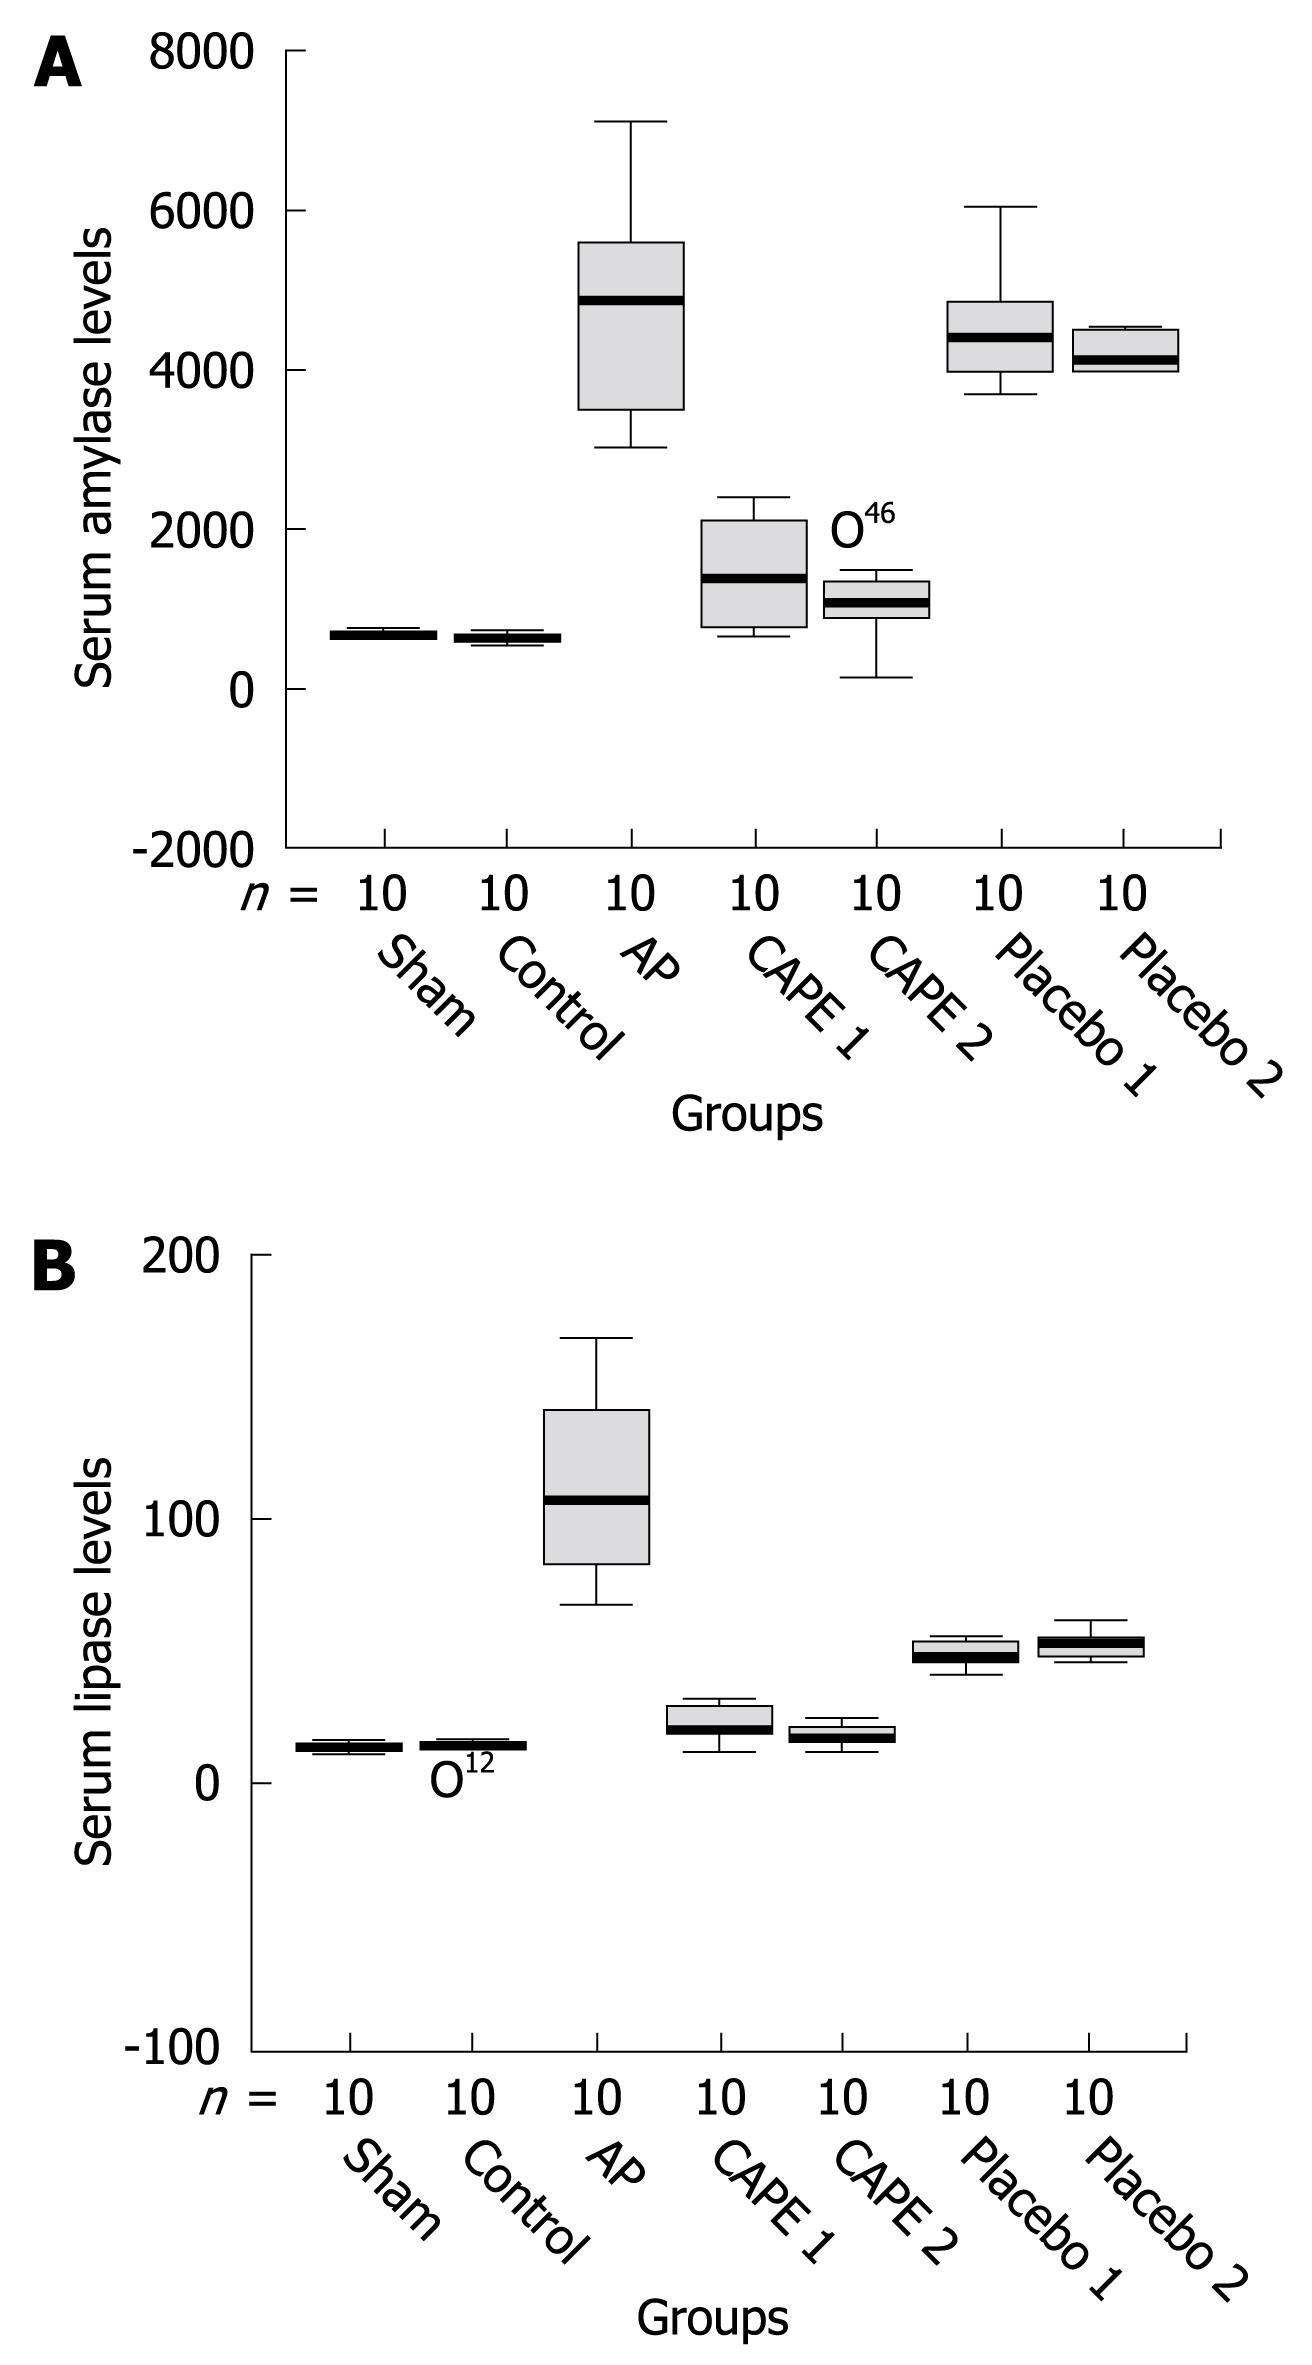
Figure 1 Serum amylase (A) and lipase (B) levels in the experimental groups.
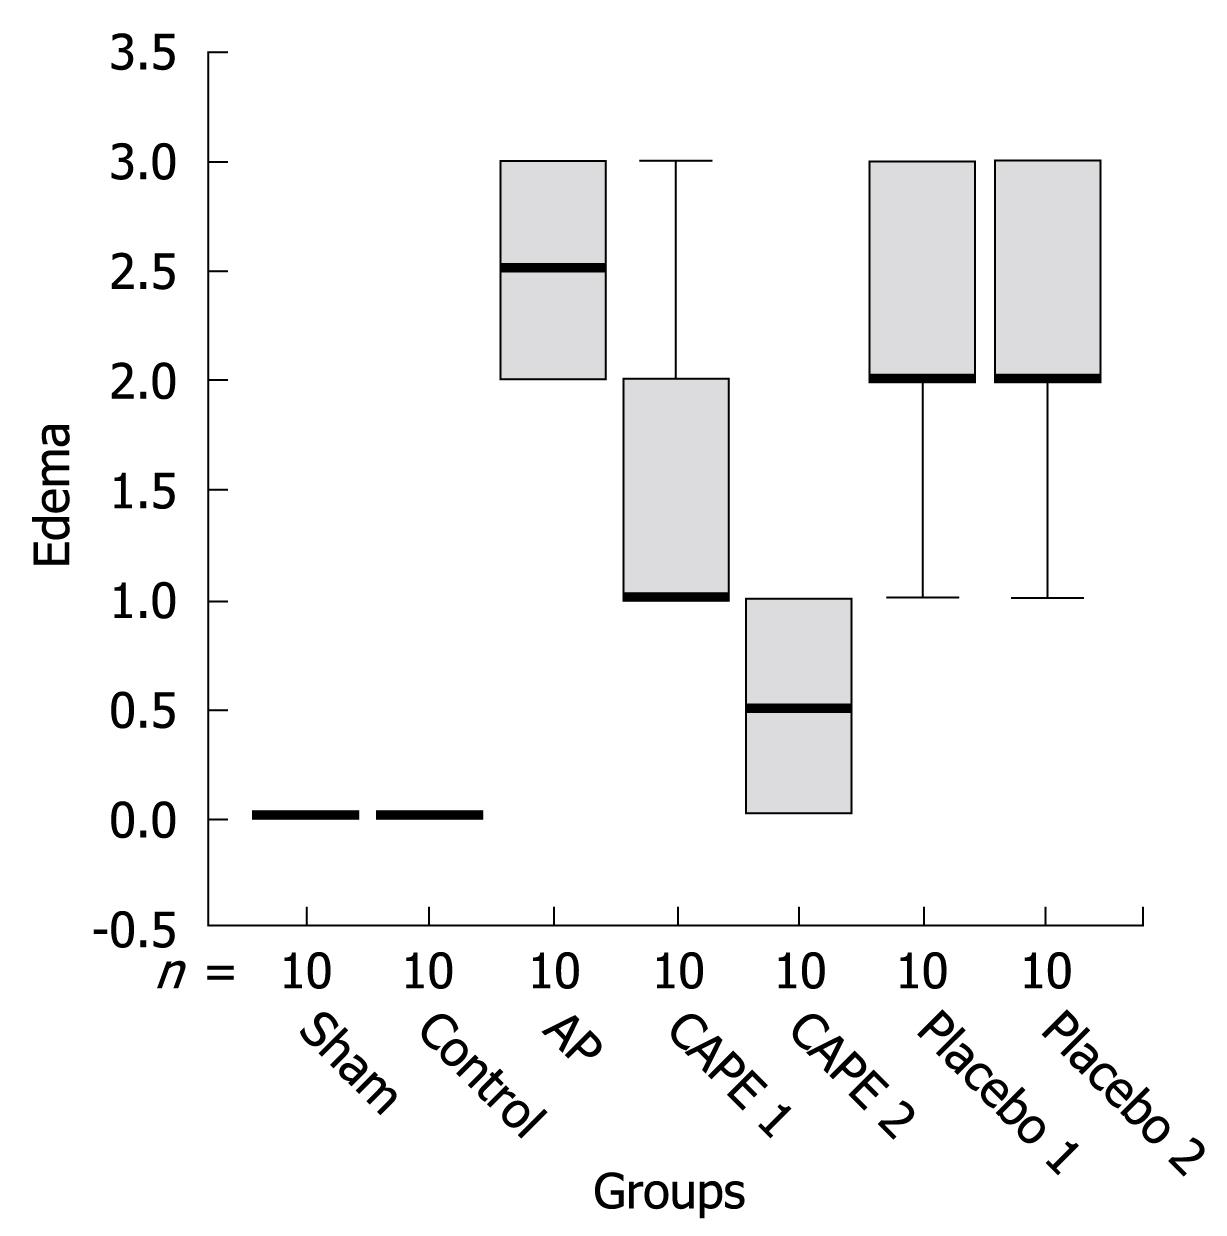
Figure 2 Edema scores in experimental AP groups.
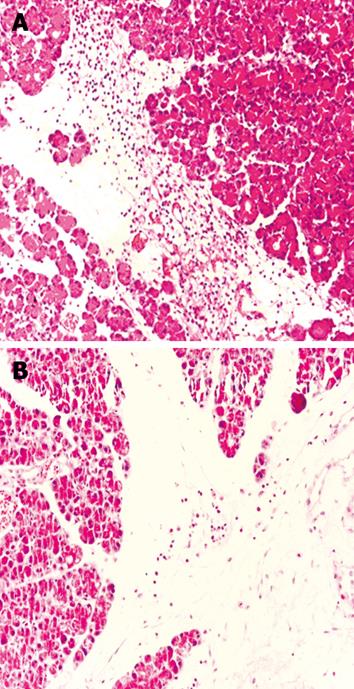
Figure 3 Histopathological features of cerulein induced AP group and after CAPE therapy.
A: Severe edema and leukocytic infiltration of pancreas after cerulein-induced AP (HE, × 200); B: Decreased infiltration in pancreatic tissue after CAPE therapy (HE, × 200).
- Citation: Buyukberber M, Savaş MC, Bagci C, Koruk M, Gulsen MT, Tutar E, Bilgic T, Ceylan N&. Therapeutic effect of caffeic acid phenethyl ester on cerulein-induced acute pancreatitis. World J Gastroenterol 2009; 15(41): 5181-5185
- URL: https://www.wjgnet.com/1007-9327/full/v15/i41/5181.htm
- DOI: https://dx.doi.org/10.3748/wjg.15.5181


