Copyright
©2009 The WJG Press and Baishideng.
World J Gastroenterol. Nov 7, 2009; 15(41): 5157-5164
Published online Nov 7, 2009. doi: 10.3748/wjg.15.5157
Published online Nov 7, 2009. doi: 10.3748/wjg.15.5157
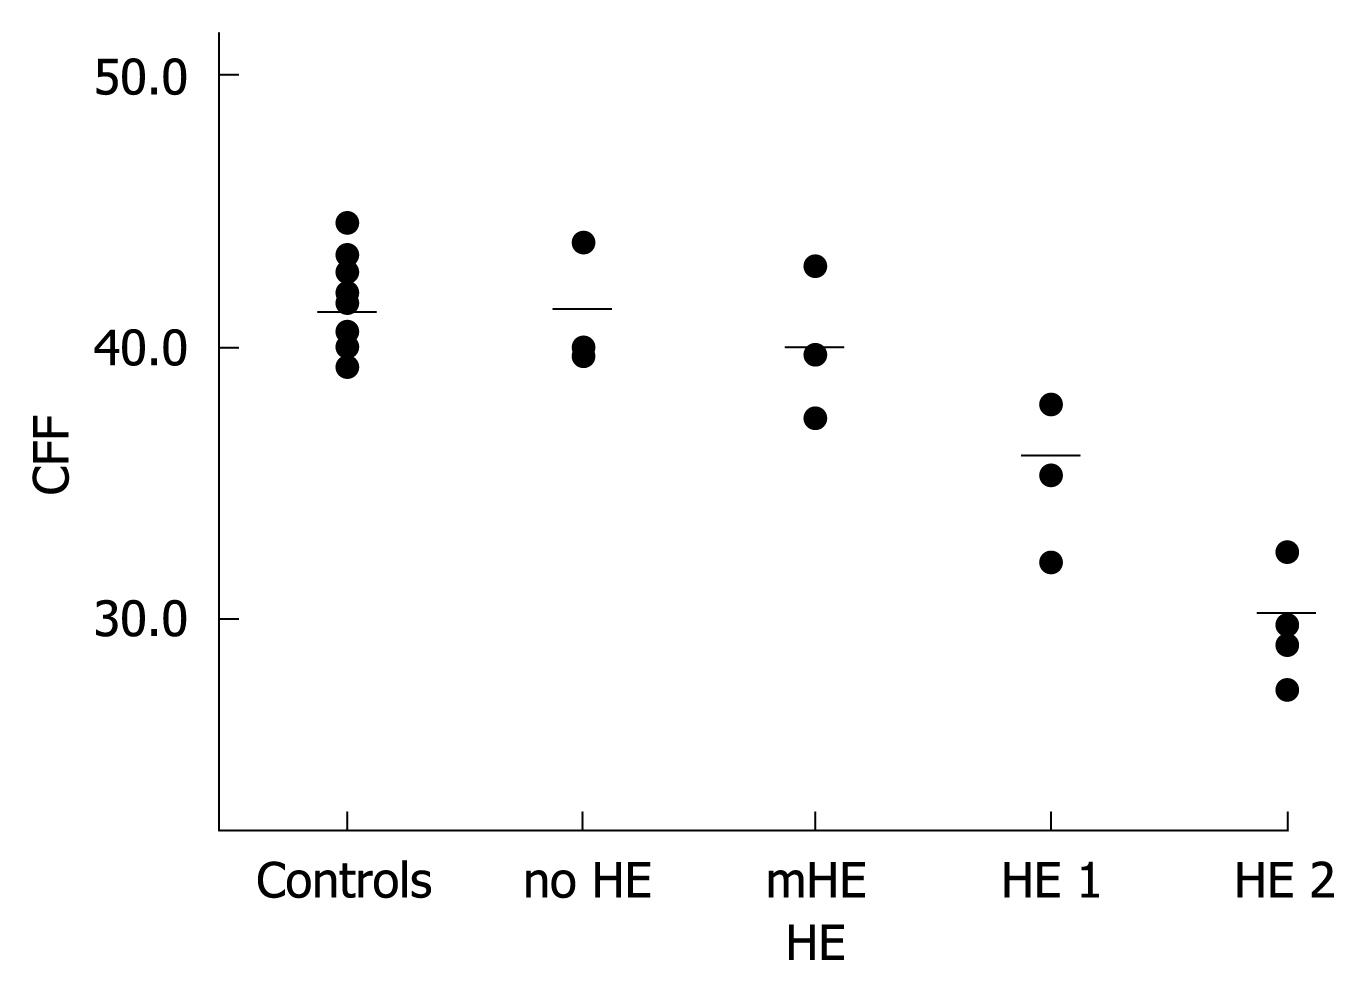
Figure 1 CFF of controls and patients.
HE grading and CFF (Hz). Circles indicate individuals’ CFF, bars represent means of groups (mean CFF of controls: 41.3 Hz; mean CFF of group with no HE: 41.4 Hz; mean CFF of group with mHE: 40.0 Hz; mean CFF of group with HE 1: 36.1 Hz; mean CFF of group with HE 2: 30.2 Hz).
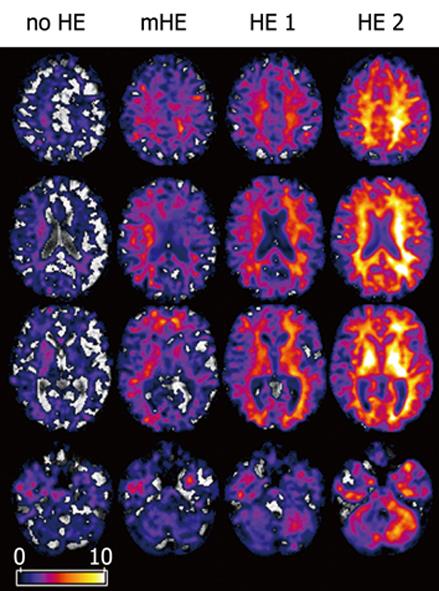
Figure 2 (Pseudo-)t-maps.
MTR of patients with no HE, mHE, HE 1 and HE 2 compared to controls. Axial views superimposed on MTR maps of representative subjects. Colored areas represent voxels with significant decrease in MTR. Grey and white matter are involved. Local statistical maxima were found in basal ganglia and posterior white matter.
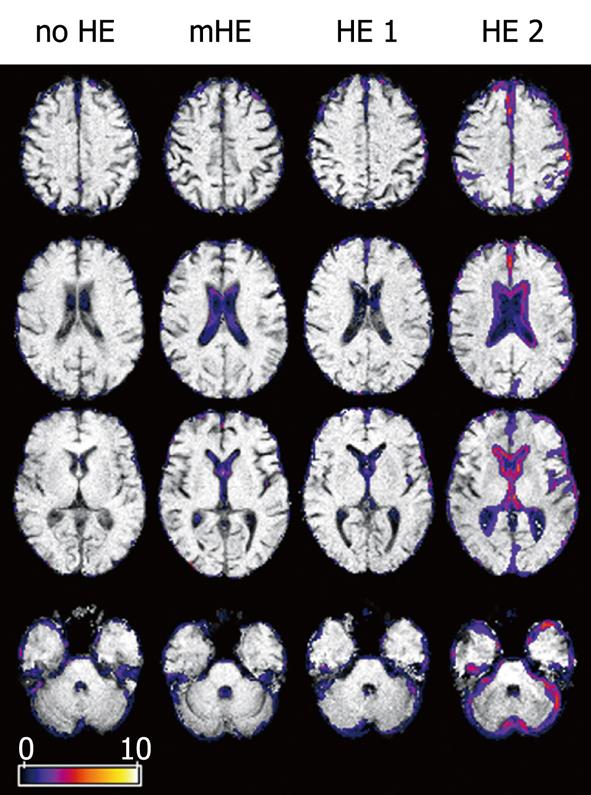
Figure 3 (Pseudo-)t-maps.
Binary data of patients with no HE, mHE, HE 1 and HE 2 compared to controls. Axial views superimposed on the binary images of representative subjects showing differences in brain size. Colored areas represent voxels with significant differences. CSF space was increased in lateral cerebral fissure; parietal, frontal and cerebellar gyration were prominent in overt HE.
Figure 4 (Pseudo-)t-maps (P < 0.
001). Areas with a correlation of subjects’ CFF and MTR. Axial views superimposed on the MTR map of a representative subject (mHE). Colored areas represent voxels with significant positive correlation between CFF and MTR. The maximum statistics of a brain parenchyma cluster were found in left frontal white matter.
Figure 5 (Pseudo-)t results (P < 0.
001). Voxel clusters with a correlation of subjects’ CFF and MTR. SnPM glass brain representation of voxel clusters with a positive correlation between CFF and MTR (sagittal, coronal and axial view). A significant correlation was seen in all lobes.
- Citation: Miese FR, Wittsack HJ, Kircheis G, Holstein A, Mathys C, Mödder U, Cohnen M. Voxel-based analyses of magnetization transfer imaging of the brain in hepatic encephalopathy. World J Gastroenterol 2009; 15(41): 5157-5164
- URL: https://www.wjgnet.com/1007-9327/full/v15/i41/5157.htm
- DOI: https://dx.doi.org/10.3748/wjg.15.5157


