Copyright
©2009 The WJG Press and Baishideng.
World J Gastroenterol. Oct 28, 2009; 15(40): 5058-5066
Published online Oct 28, 2009. doi: 10.3748/wjg.15.5058
Published online Oct 28, 2009. doi: 10.3748/wjg.15.5058
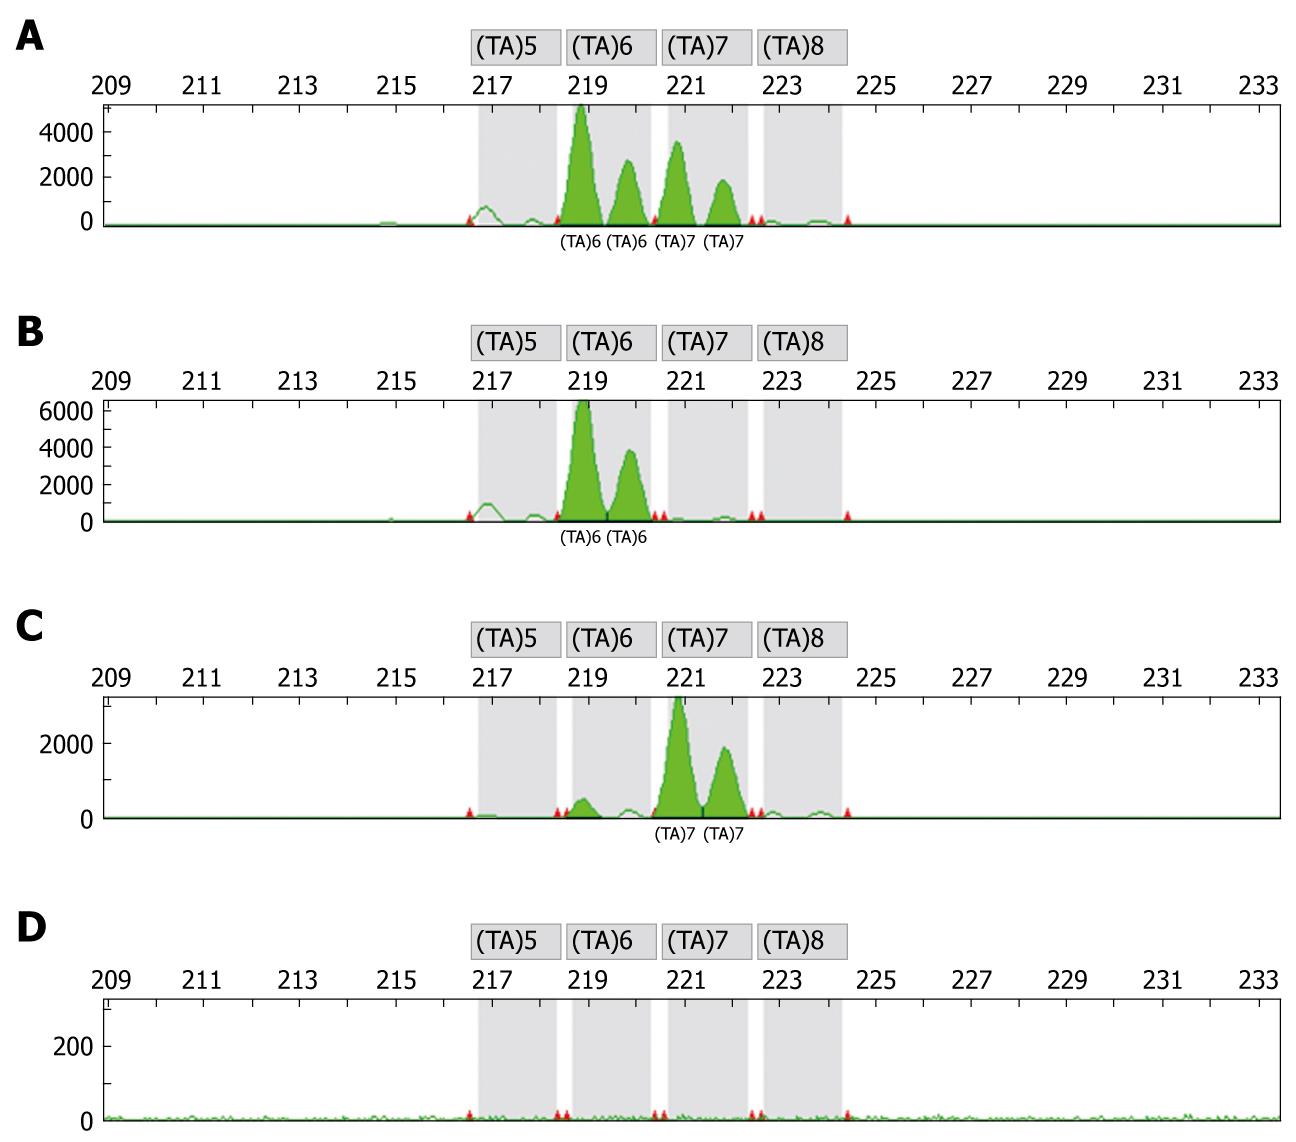
Figure 1 Electropherograms/gene scanning: Example results of TA promoter region of the UGT1A1 gene.
A: Control heterozygous genotype (6/7); B: Patient homozygous genotype (6/6); C: Patient homozygous genotype (7/7); D: Negative control.
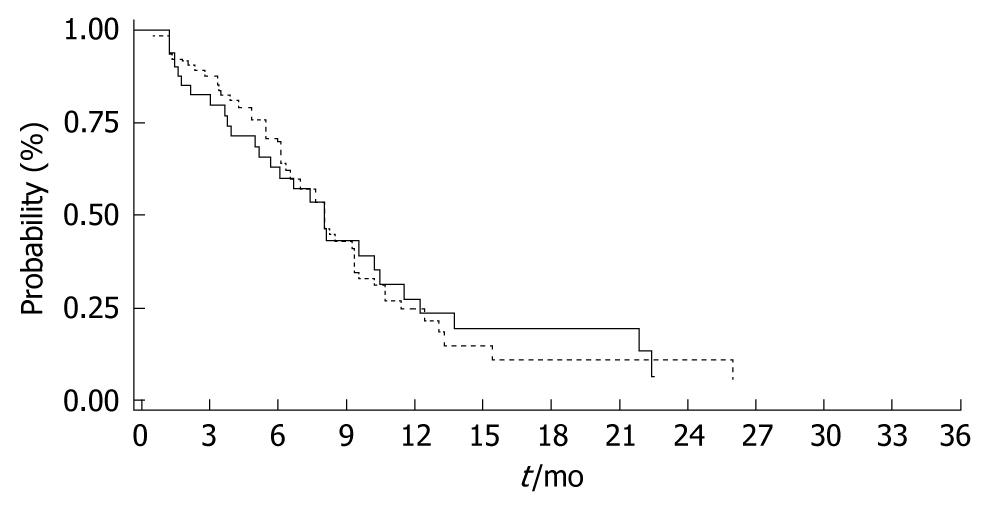
Figure 2 Time to progression and UGT1A1 status.
WT (6/6) 8.1 mo (range = 5.7-10.5) vs (6/7, 7/7) 8.2 mo (range = 6.3-9.4), P > 0.05; WT: Solid line, (6/7, 7/7): Dashed line.
Figure 3 Overall survival and UGT1A1 status.
WT (6/6) 21.2 mo (range = 12.3-41.0) vs (6/7, 7/7) 18.9 mo (range = 16.4-34.1), P > 0.05; WT: Solid line, (6/7, 7/7): Dashed line.
-
Citation: Schulz C, Heinemann V, Schalhorn A, Moosmann N, Zwingers T, Boeck S, Giessen C, Stemmler HJ.
UGT1A1 gene polymorphism: Impact on toxicity and efficacy of irinotecan-based regimens in metastatic colorectal cancer. World J Gastroenterol 2009; 15(40): 5058-5066 - URL: https://www.wjgnet.com/1007-9327/full/v15/i40/5058.htm
- DOI: https://dx.doi.org/10.3748/wjg.15.5058


