Copyright
©2009 The WJG Press and Baishideng.
World J Gastroenterol. Oct 28, 2009; 15(40): 5053-5057
Published online Oct 28, 2009. doi: 10.3748/wjg.15.5053
Published online Oct 28, 2009. doi: 10.3748/wjg.15.5053
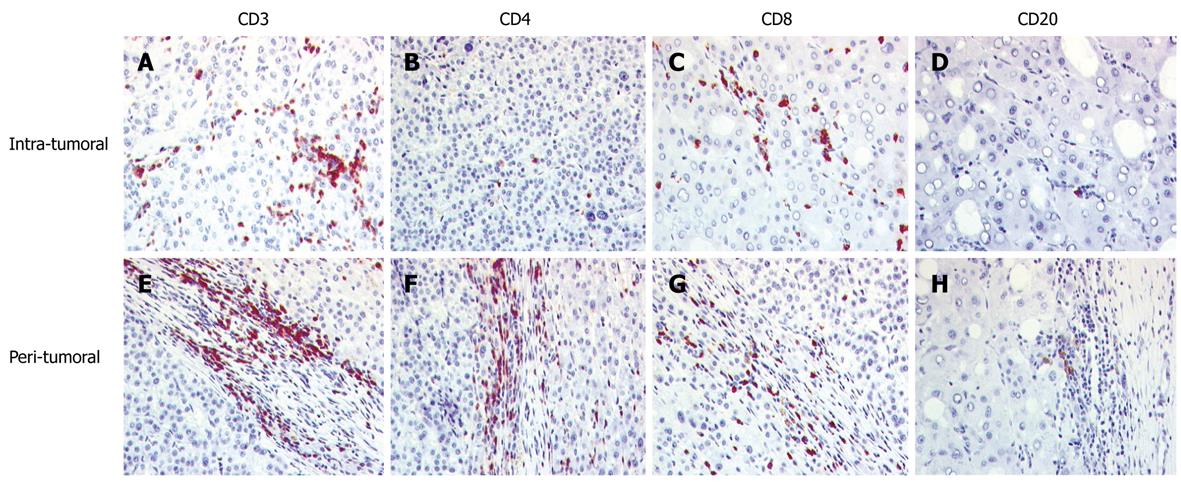
Figure 1 Lymphocytic infiltration in the tumor tissue of hepatocellular carcinoma.
A-D: Intratumoral region; E-H: Tumor/liver interface (peritumoral); A and E: CD3+ T cells are the main infiltrate with a higher amount in the interface region; B and F: CD4+ cells were mainly located in the peritumoral area; C and G: In the tumor tissue, CD8+ cells were more often seen; D and H: CD20+ cells were scarce.
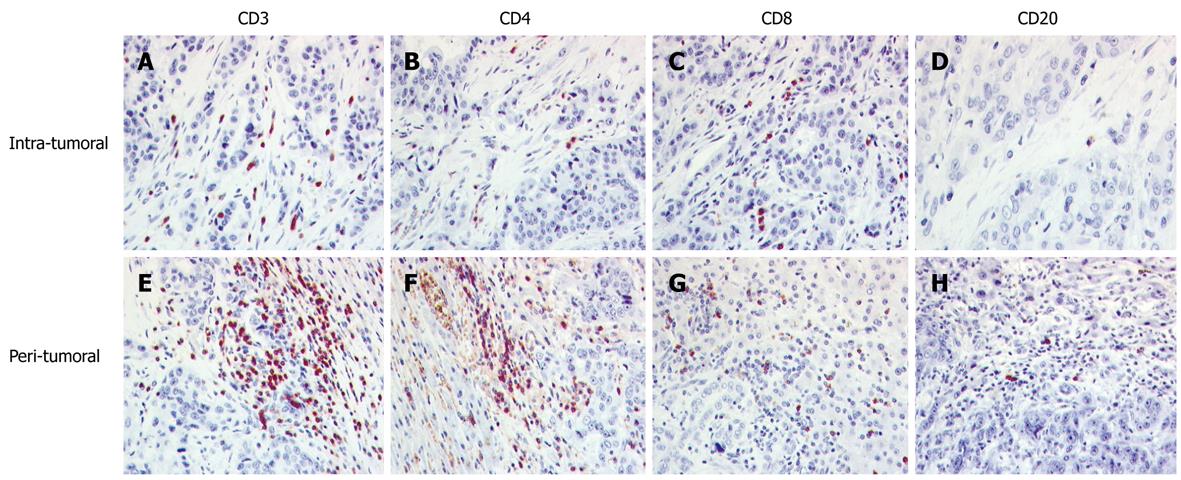
Figure 2 The distribution of tumor infiltrating lymphocytes in cholangiocellular carcinoma.
A-D: Intratumoral region; E-H: Tumor/liver interface (peritumoral); A and E: CD3+ T cells were the dominant infiltrate; B and F: The quantity of CD4+ and CD8+ cells were opposite with a higher level of CD4 cells in the peritumoral region; C and G: CD8+ cells were more often found in the tumor tissue; D and H: CD20+ cells were scarce.
- Citation: Kasper HU, Drebber U, Stippel DL, Dienes HP, Gillessen A. Liver tumor infiltrating lymphocytes: Comparison of hepatocellular and cholangiolar carcinoma. World J Gastroenterol 2009; 15(40): 5053-5057
- URL: https://www.wjgnet.com/1007-9327/full/v15/i40/5053.htm
- DOI: https://dx.doi.org/10.3748/wjg.15.5053


