Copyright
©2009 The WJG Press and Baishideng.
World J Gastroenterol. Sep 21, 2009; 15(35): 4453-4456
Published online Sep 21, 2009. doi: 10.3748/wjg.15.4453
Published online Sep 21, 2009. doi: 10.3748/wjg.15.4453
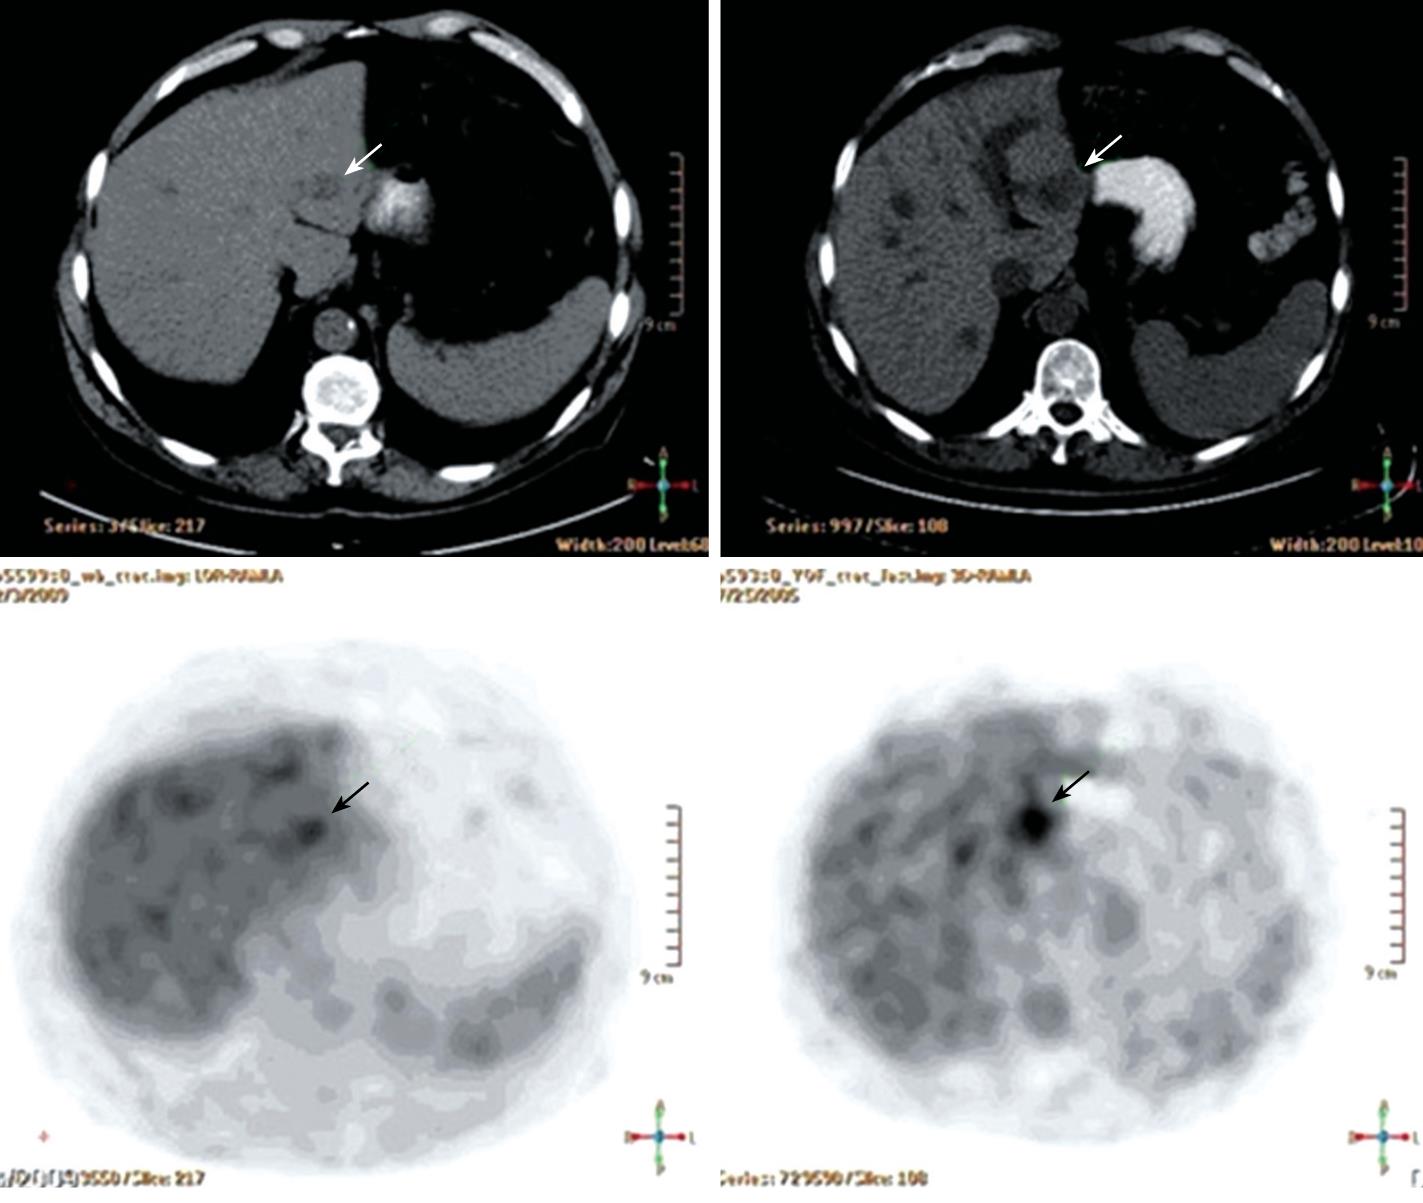
Figure 1 Axial fused PET-CT scans of the upper abdomen before (Right-2005) and after (Left-2009) treatment.
Right- An FDG-avid lesion is seen in the left lobe of the liver (arrow). Left-The lesion is smaller with decreased intensity of FDG uptake (arrow).
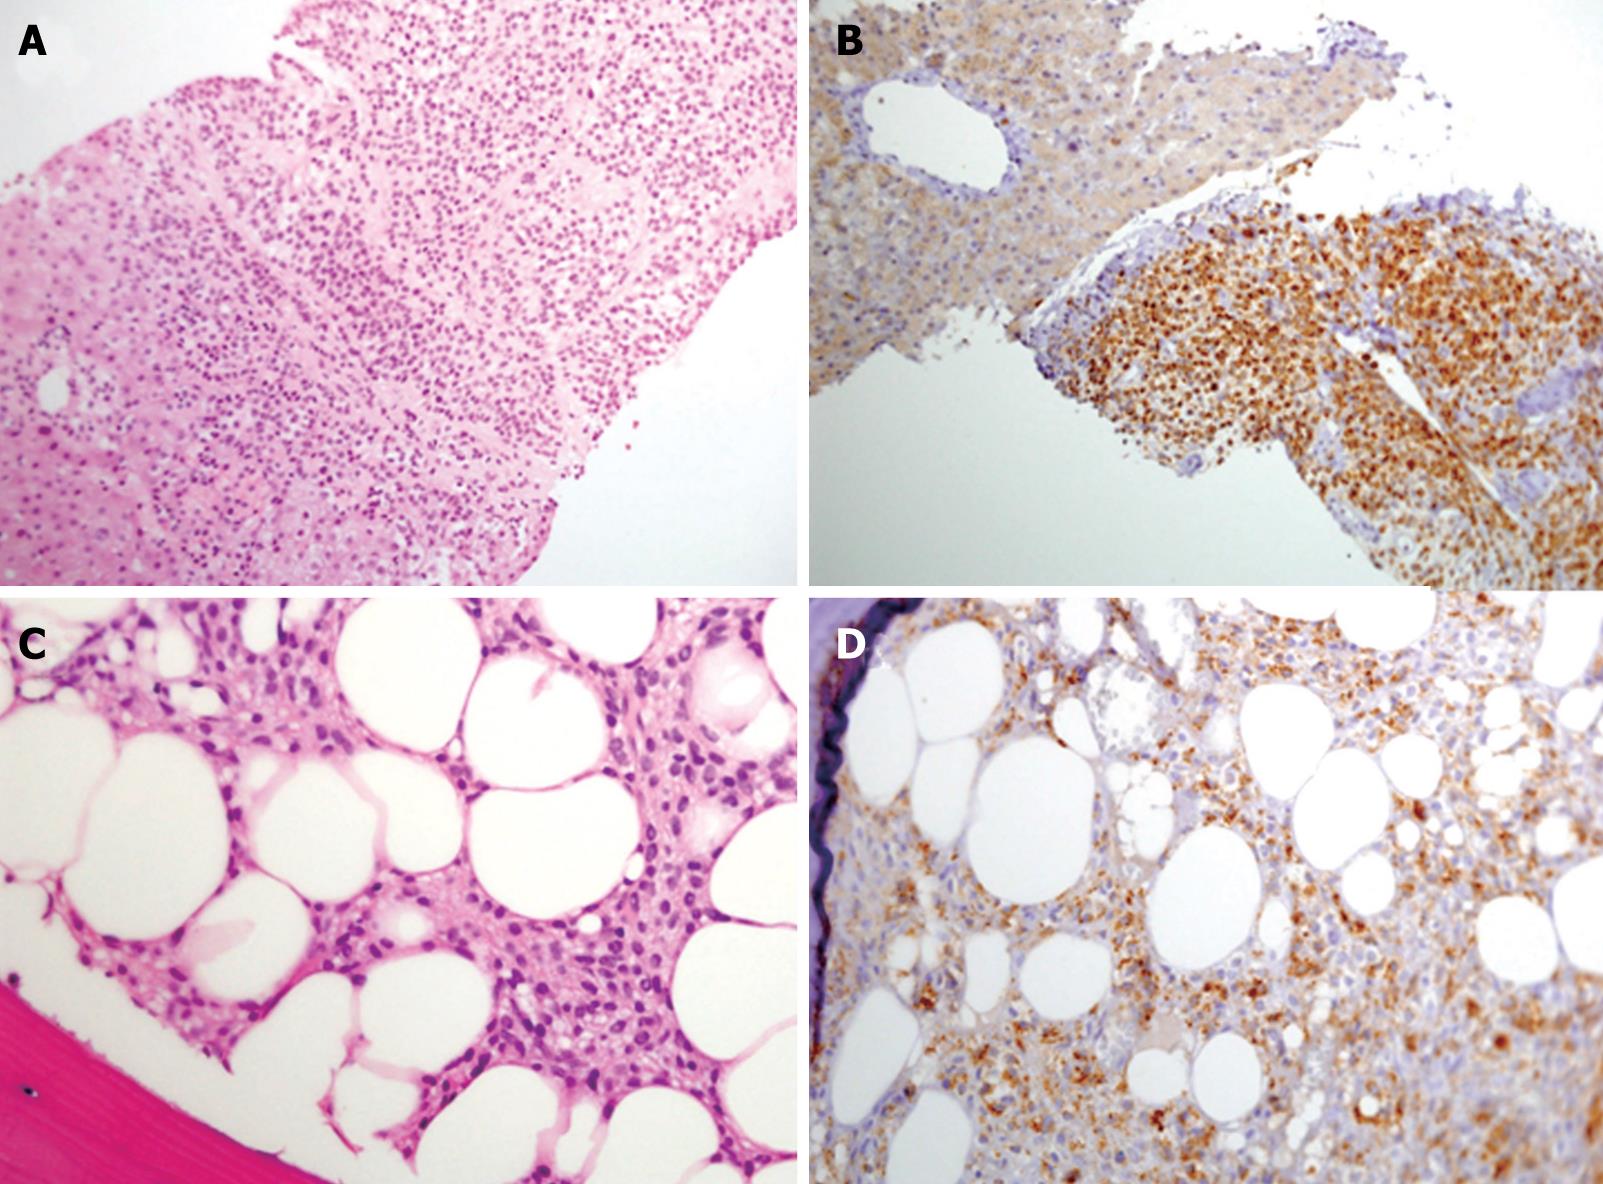
Figure 2 Histological findings.
A, B: Liver core needle biopsy; C, D: Bone marrow biopsy. A: Infiltration by small to medium-sized tumor cells is seen. In the left lower part of the picture, normal residual liver parenchyma is seen (HE, × 200); B: Immunohistochemical stain for TRAcP is positive in tumor cells (× 200); C: Hairy leukemic cells are seen in the bone marrow (HE, × 400); D: The immunohistochemical stain for TRAcP is positive in hairy cells.
- Citation: Sahar N, Schiby G, Davidson T, Kneller A, Apter S, Farfel Z. Hairy cell leukemia presenting as multiple discrete hepatic lesions. World J Gastroenterol 2009; 15(35): 4453-4456
- URL: https://www.wjgnet.com/1007-9327/full/v15/i35/4453.htm
- DOI: https://dx.doi.org/10.3748/wjg.15.4453


