Copyright
©2009 The WJG Press and Baishideng.
World J Gastroenterol. Sep 21, 2009; 15(35): 4444-4445
Published online Sep 21, 2009. doi: 10.3748/wjg.15.4444
Published online Sep 21, 2009. doi: 10.3748/wjg.15.4444
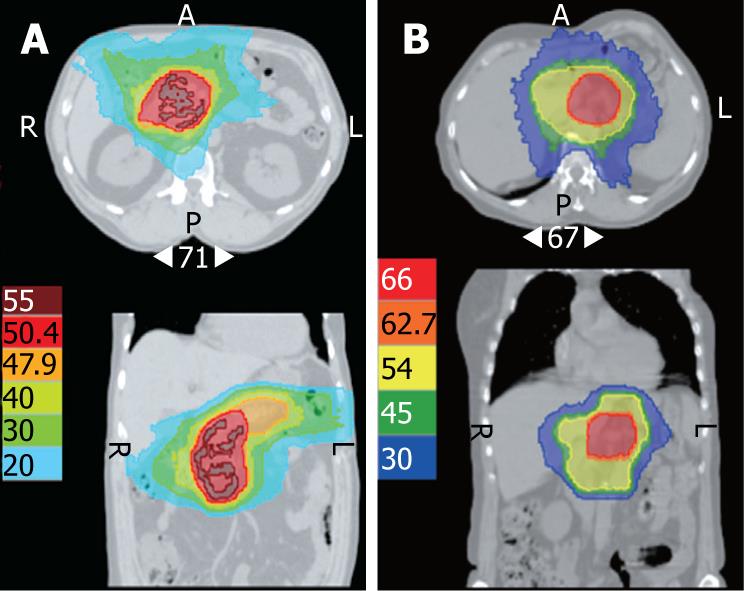
Figure 1 Distribution of isodoses with HT treatment planning in patient 1 (A) and patient 2 (B), in axial and coronal representation.
The different doses are represented with different colors. Red color represents the target volume dose.
- Citation: Chargari C, Campana F, Beuzeboc P, Zefkili S, Kirova YM. Preliminary experience of helical tomotherapy for locally advanced pancreatic cancer. World J Gastroenterol 2009; 15(35): 4444-4445
- URL: https://www.wjgnet.com/1007-9327/full/v15/i35/4444.htm
- DOI: https://dx.doi.org/10.3748/wjg.15.4444


