Copyright
©2009 The WJG Press and Baishideng.
World J Gastroenterol. Sep 21, 2009; 15(35): 4439-4443
Published online Sep 21, 2009. doi: 10.3748/wjg.15.4439
Published online Sep 21, 2009. doi: 10.3748/wjg.15.4439
Figure 1 Histopathological changes in pancreatic tissues in three groups (HE stain).
A: Control group (× 200); B: ANP rats without CQCQD treatment (× 400); C: ANP rats with CQCQD treatment (× 200).
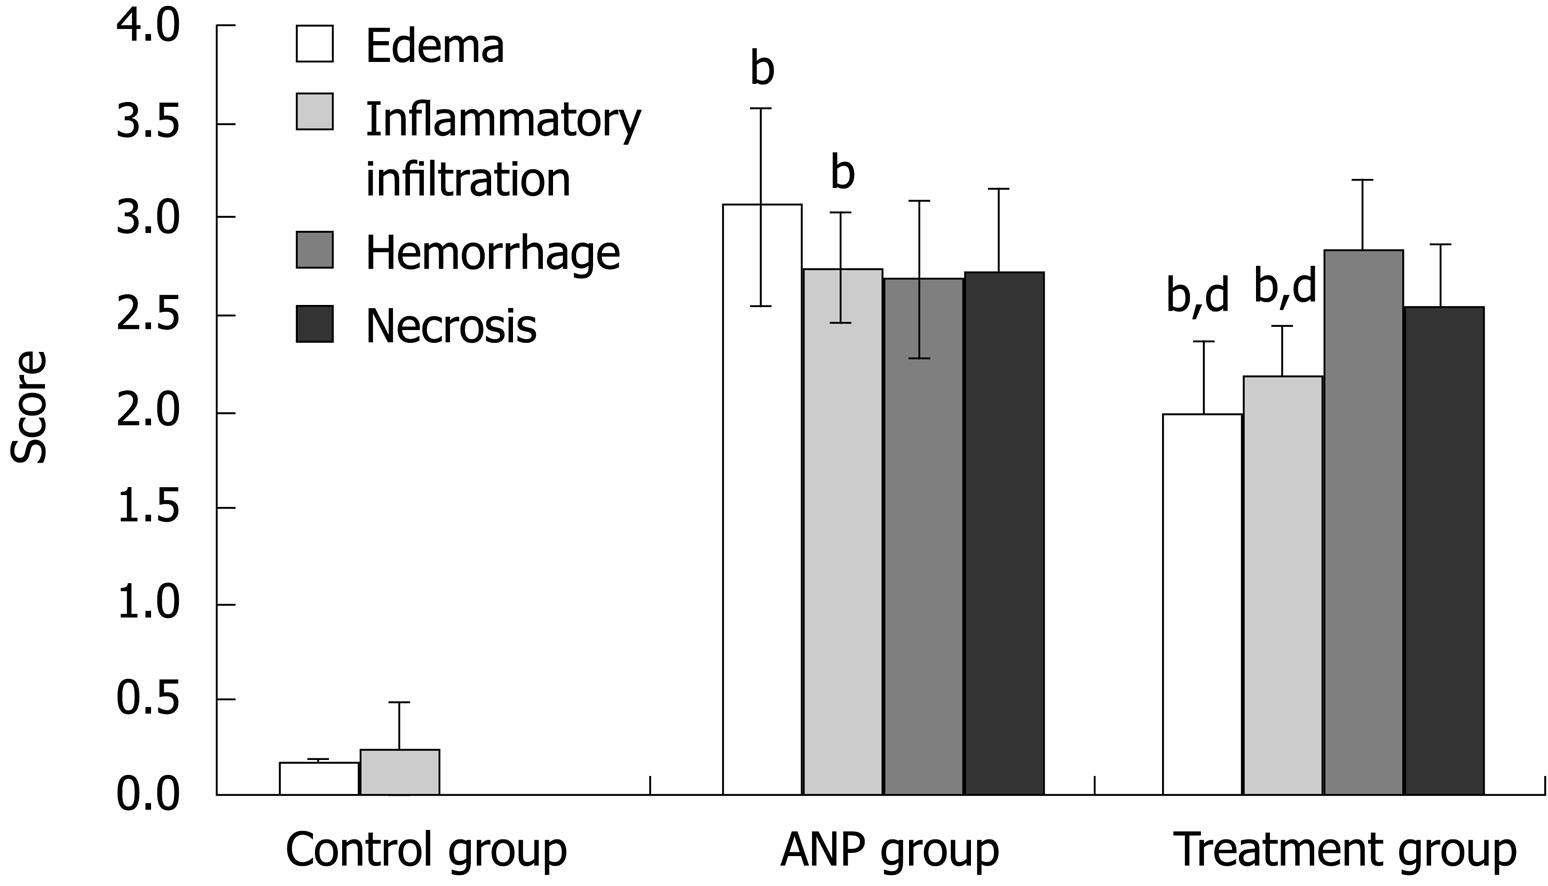
Figure 2 Histological scores of pancreatic tissues in three groups (n = 20, mean ± SD).
bP < 0.001 vs control group, dP < 0.001 vs ANP group.
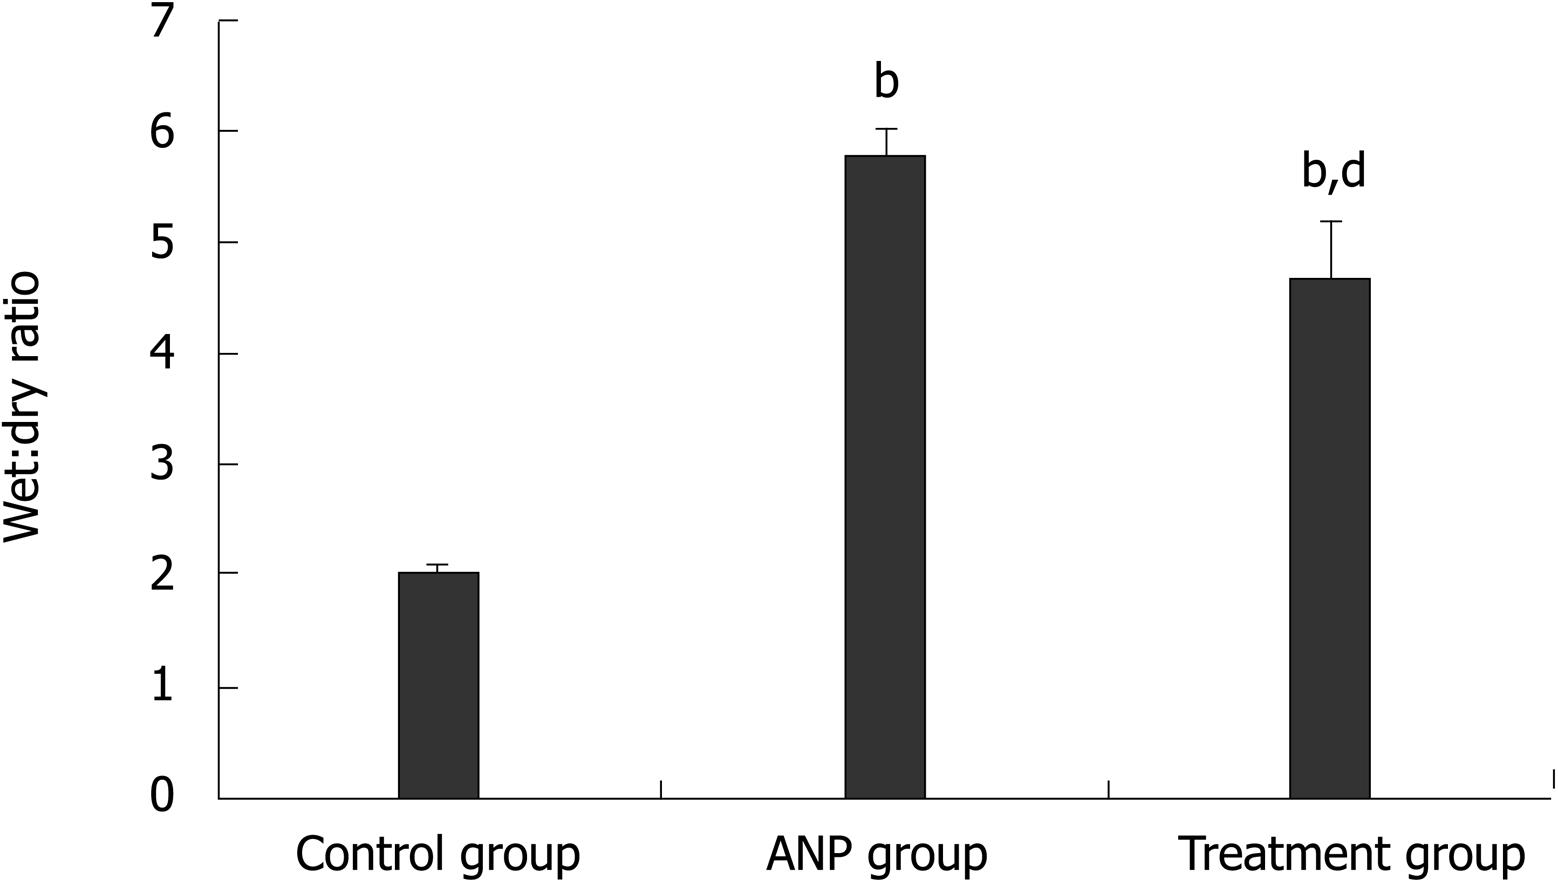
Figure 3 W/D ratio in three groups.
bP < 0.001 vs control group; dP < 0.001 vs ANP group.
- Citation: Deng LH, Xiang DK, Xue P, Zhang HY, Huang L, Xia Q. Effects of Chai-Qin-Cheng-Qi Decoction on cefotaxime in rats with acute necrotizing pancreatitis. World J Gastroenterol 2009; 15(35): 4439-4443
- URL: https://www.wjgnet.com/1007-9327/full/v15/i35/4439.htm
- DOI: https://dx.doi.org/10.3748/wjg.15.4439


