Copyright
©2009 The WJG Press and Baishideng.
World J Gastroenterol. Sep 21, 2009; 15(35): 4410-4414
Published online Sep 21, 2009. doi: 10.3748/wjg.15.4410
Published online Sep 21, 2009. doi: 10.3748/wjg.15.4410
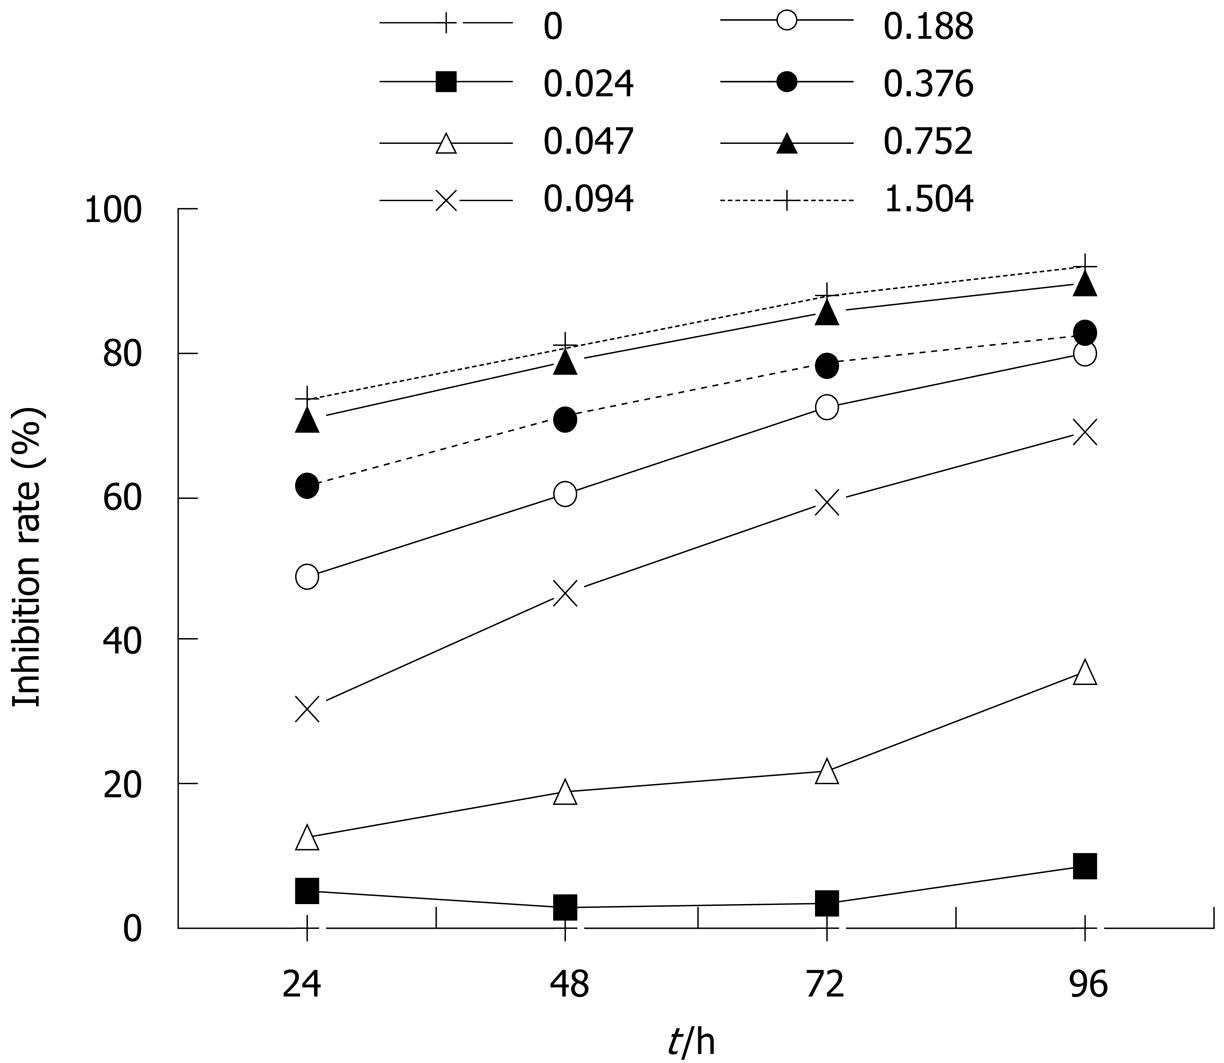
Figure 1 Effect of different concentrations (0-1.
504 mmol/L) of paeonol on proliferation of HT-29 cells. The inhibition of cell proliferation showed a dose- as well as time-dependent increase.
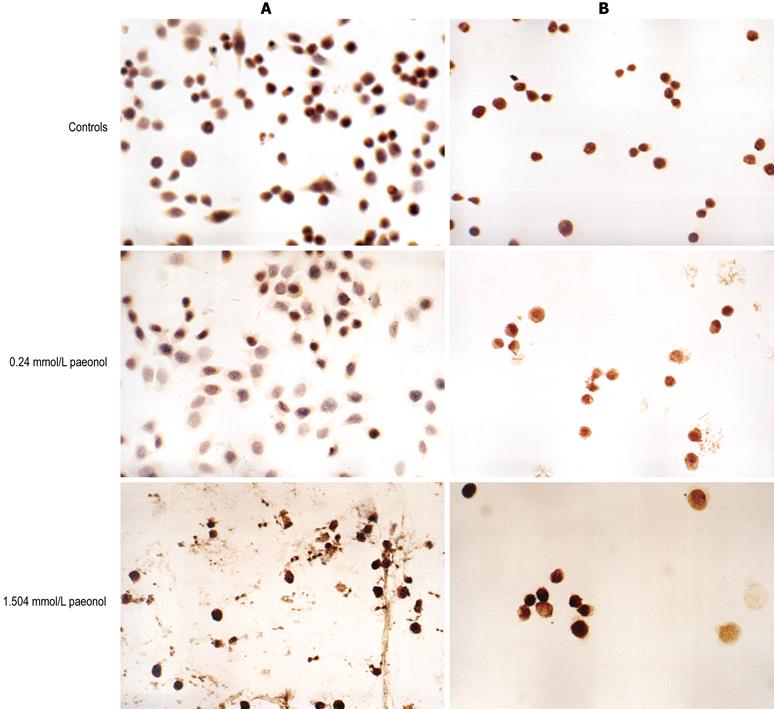
Figure 2 Expression of COX-2 (A) and p27 (B) in HT-29 cells induced by paeonol (× 400).
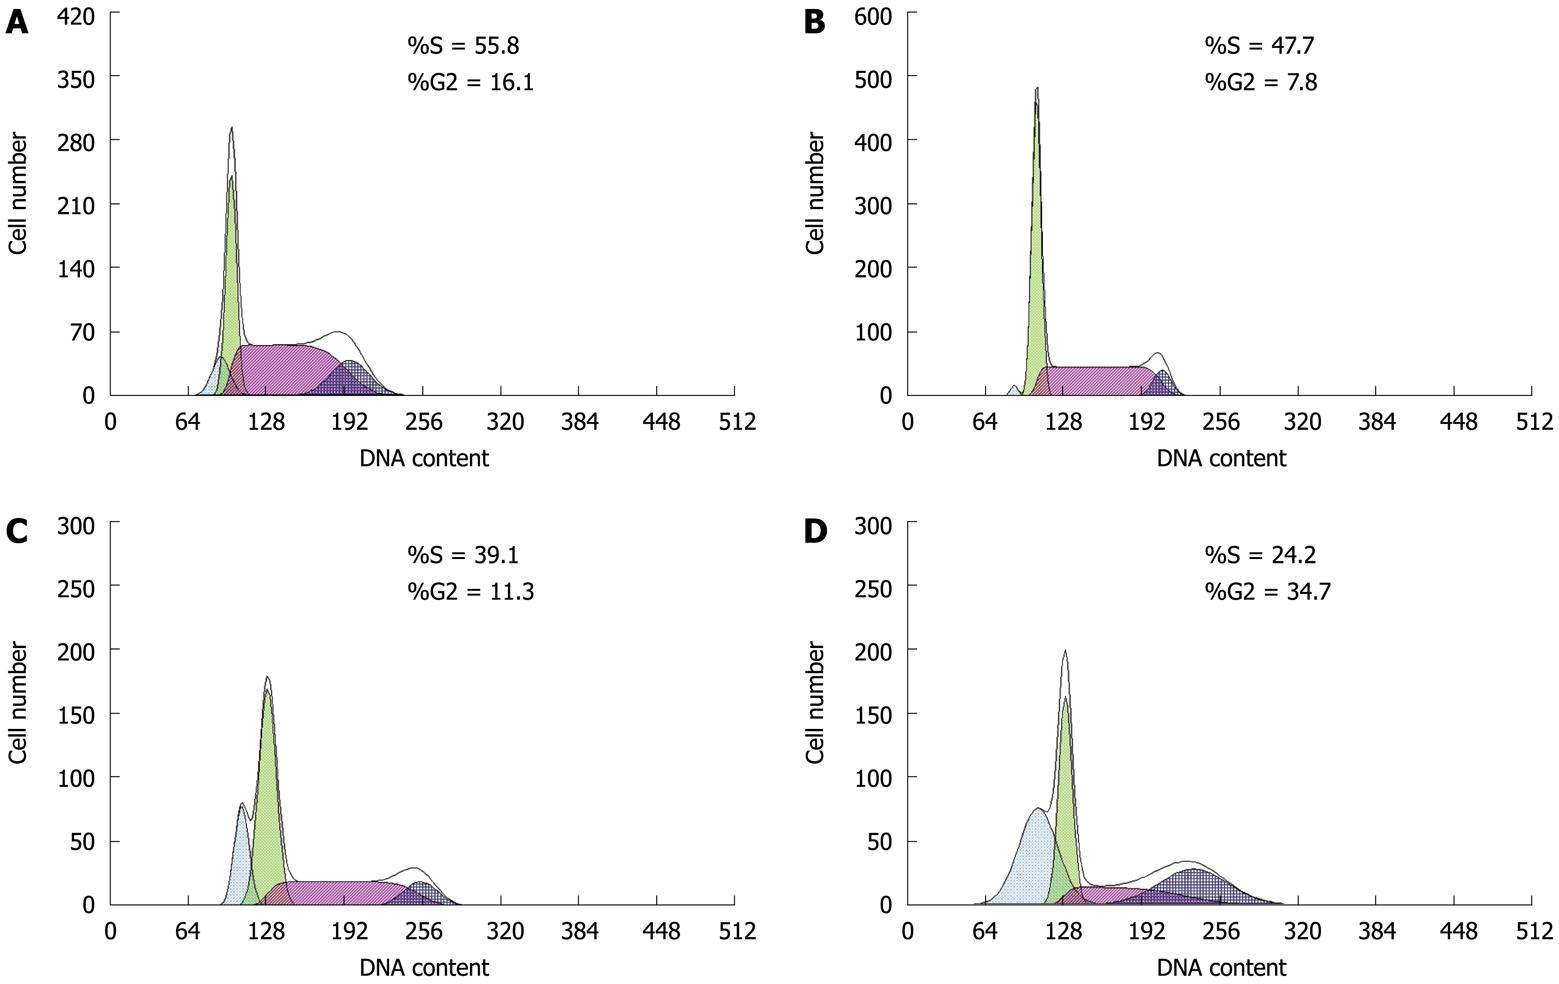
Figure 3 Flow cytometry detects apoptosis of HT-29 cells induced by paeonol.
A: Controls; B: 0.094 mmol/L paeonol; C: 0.376 mmol/L paeonol; D: 1.504 mmol/L paeonol.
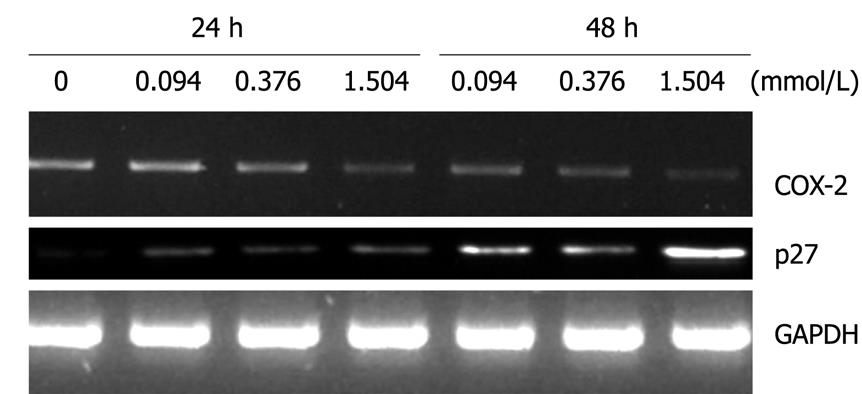
Figure 4 Changes in COX-2 and p27 induced by paeonol.
After exposure to different concentrations for 24 and 48 h, HT-29 cells were observed to have a dose-dependent decrease in COX-2, but an increase in p27. GAPDH acted as an internal control.
- Citation: Ye JM, Deng T, Zhang JB. Influence of paeonol on expression of COX-2 and p27 in HT-29 cells. World J Gastroenterol 2009; 15(35): 4410-4414
- URL: https://www.wjgnet.com/1007-9327/full/v15/i35/4410.htm
- DOI: https://dx.doi.org/10.3748/wjg.15.4410


