Copyright
©2009 The WJG Press and Baishideng.
World J Gastroenterol. Aug 21, 2009; 15(31): 3891-3900
Published online Aug 21, 2009. doi: 10.3748/wjg.15.3891
Published online Aug 21, 2009. doi: 10.3748/wjg.15.3891
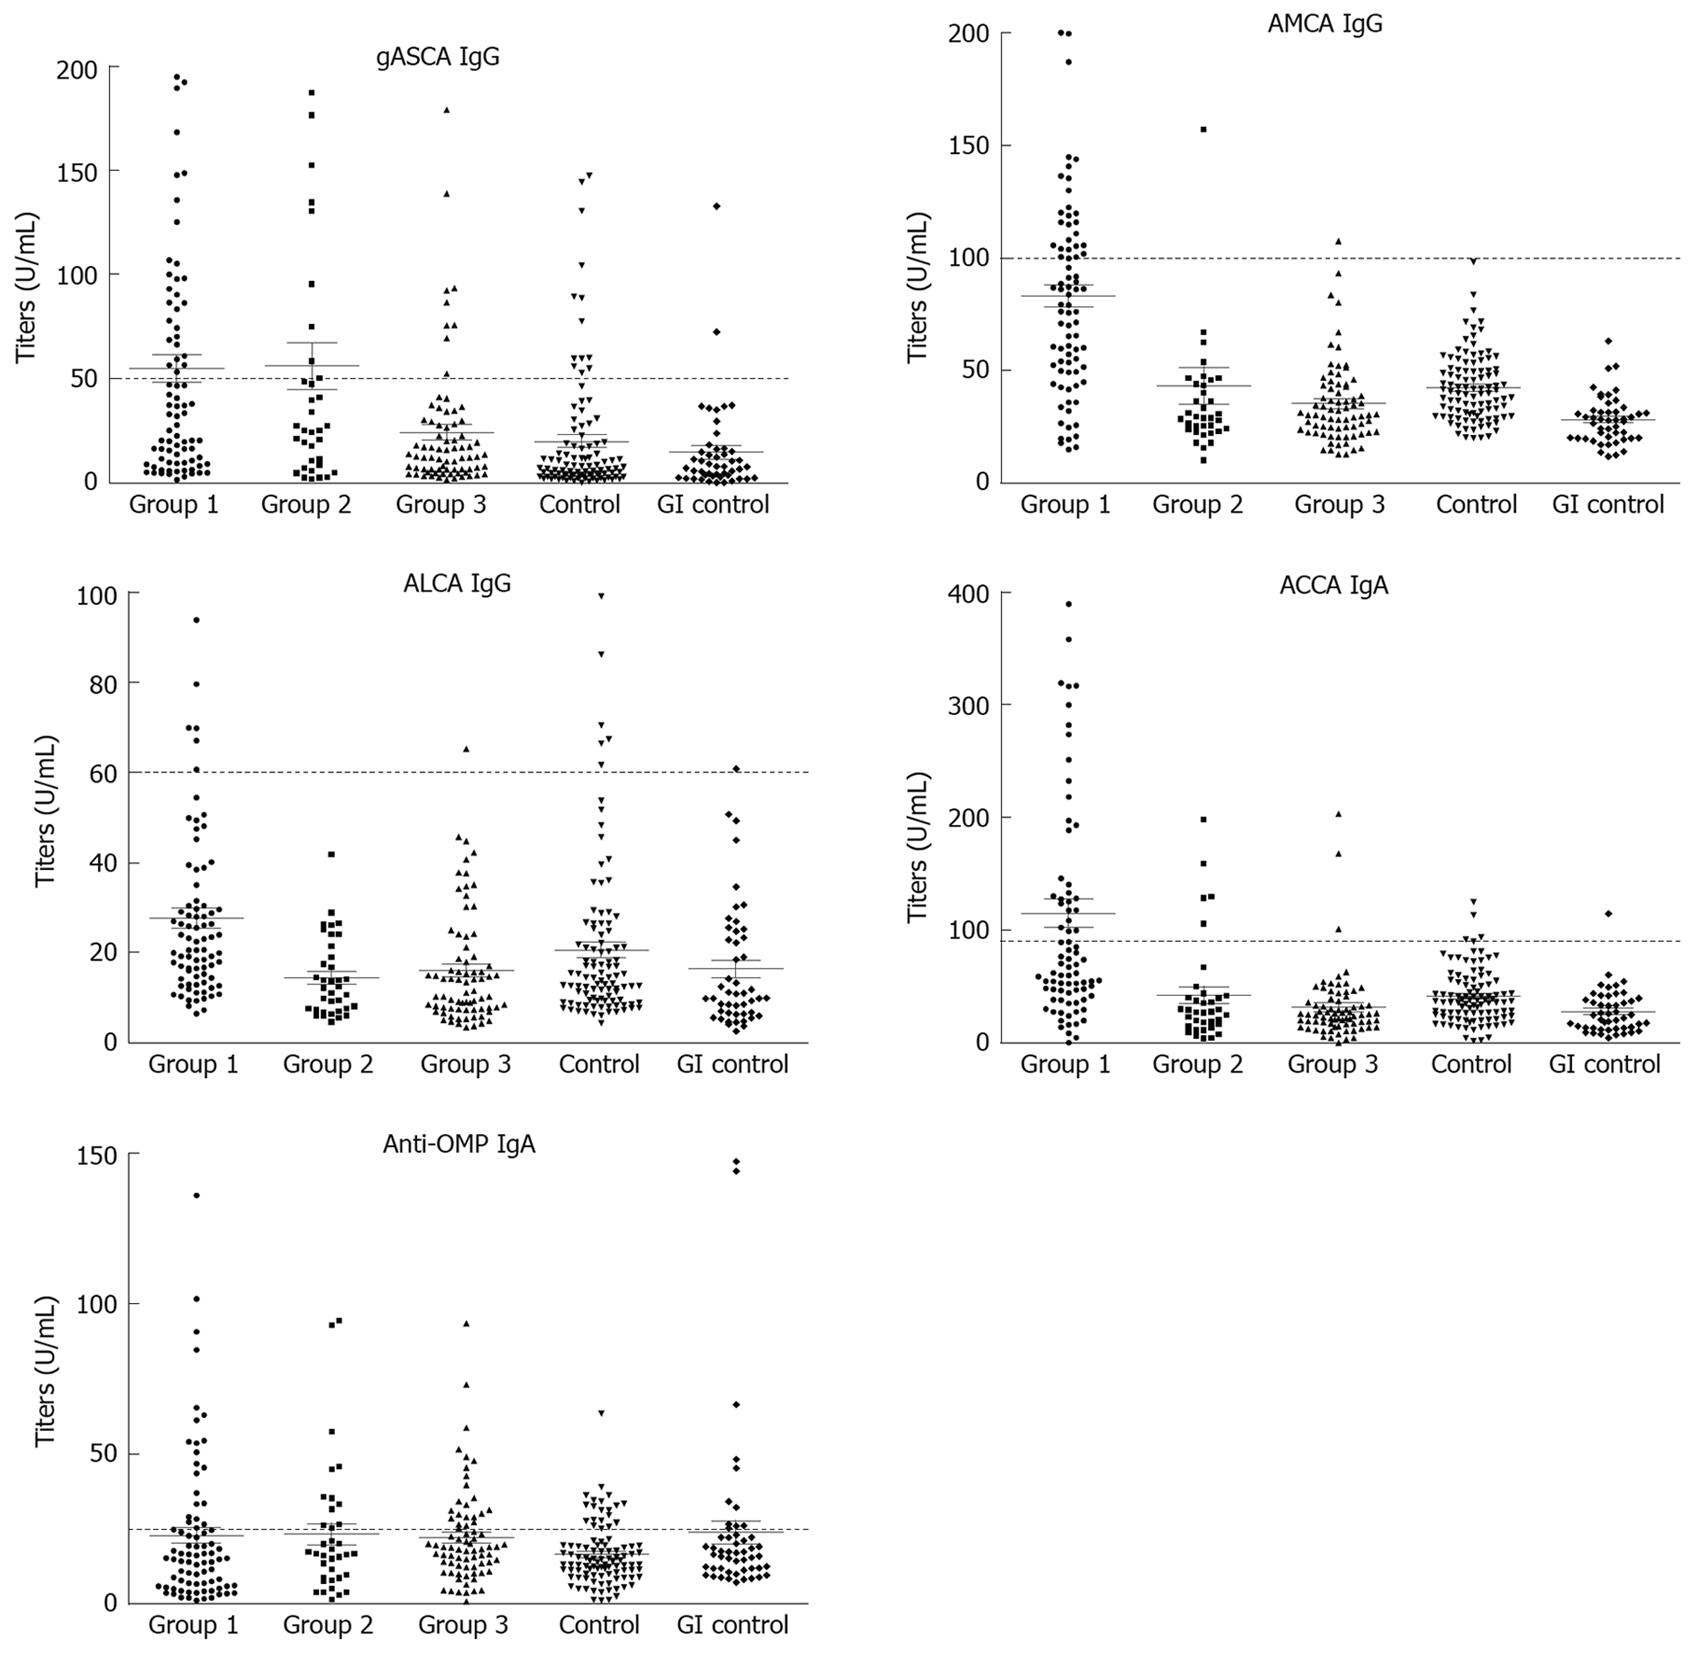
Figure 1 Anti-microbial antibody levels in 190 patients with celiac disease and in control groups.
Individual values are shown by black spots. Mean values with standard error bars are indicated in gray. Cut-off values for positivity are pointed out by dotted line and 50, 100, 60, 90 and 25 U/mL for gASCA IgG, AMCA IgG, ALCA IgG, ACCA IgA and OMP IgA, respectively.
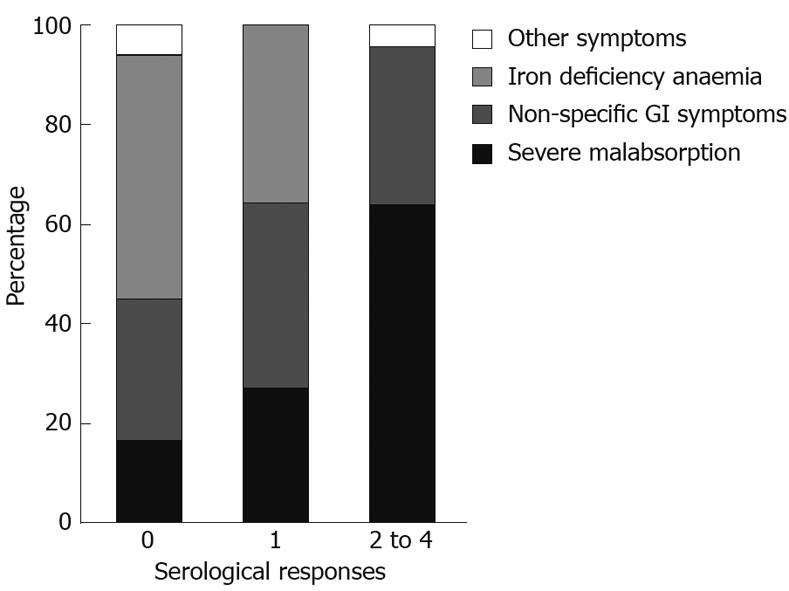
Figure 2 Clinical presentation of celiac disease according to serological response.
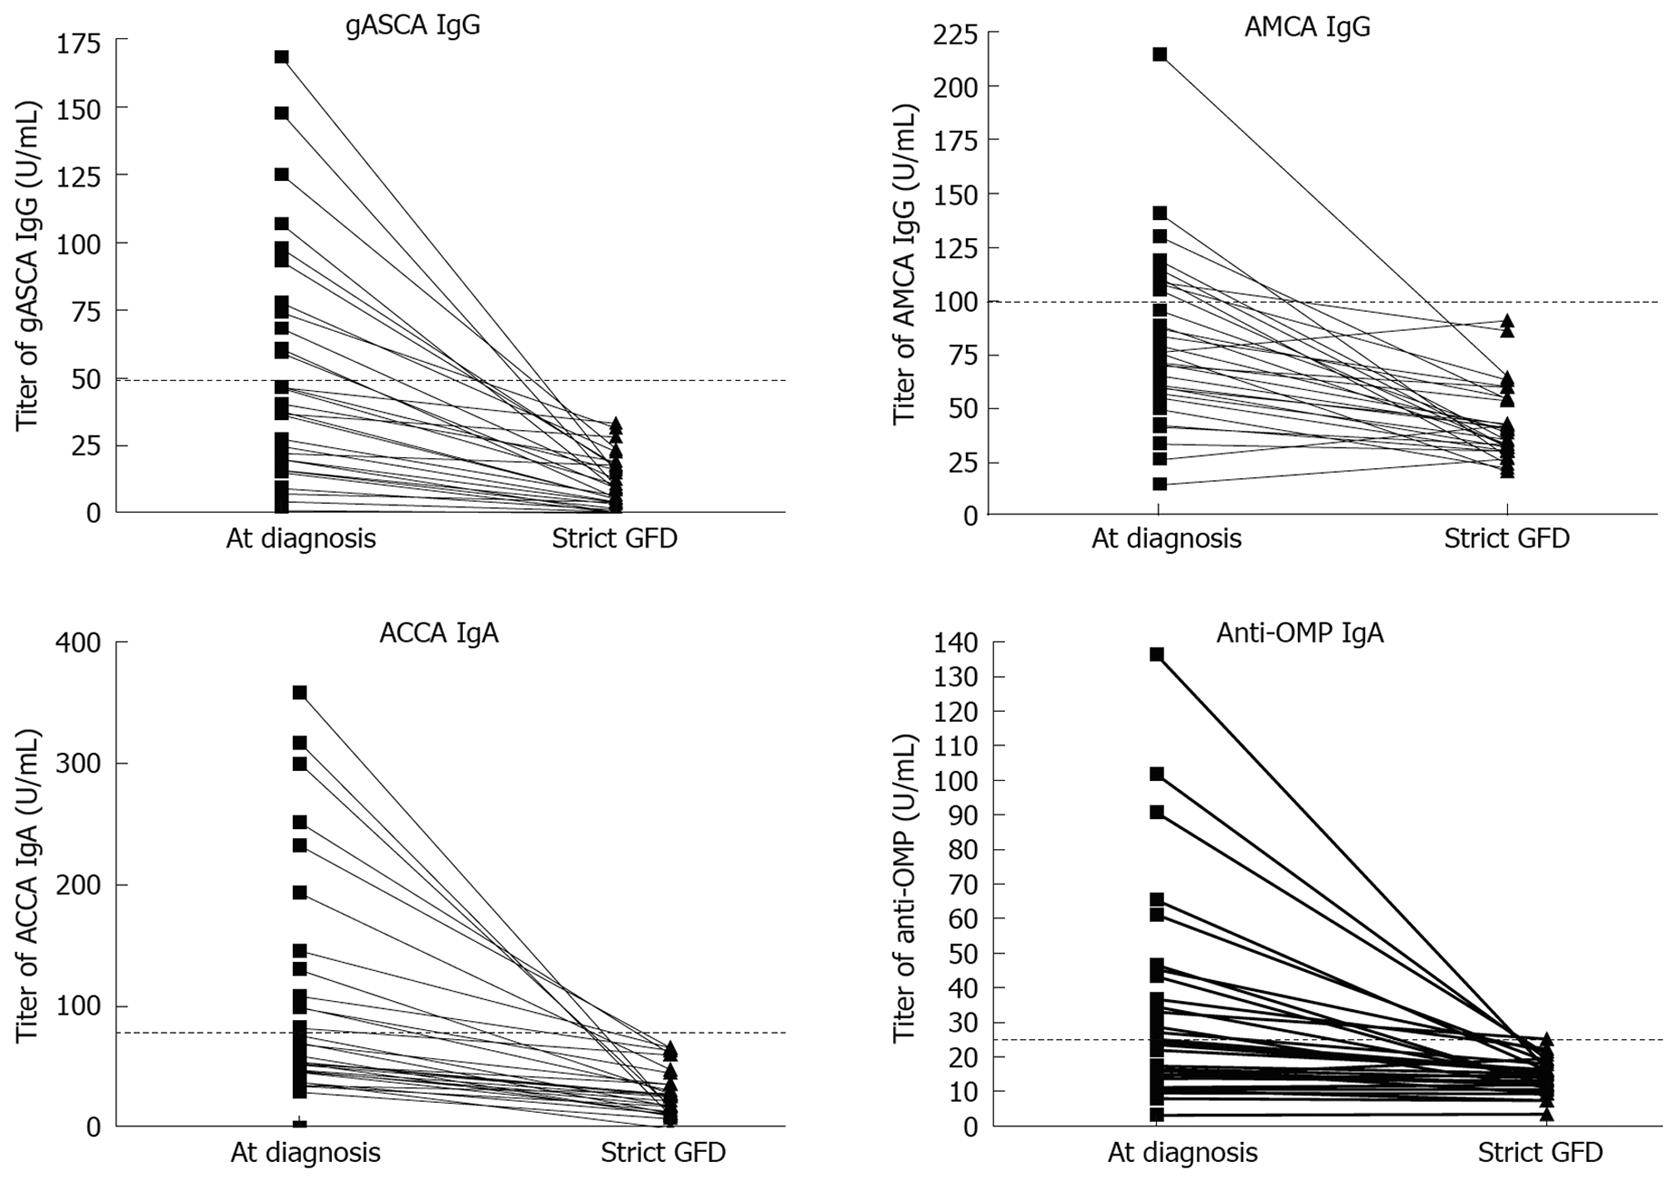
Figure 3 Individual anti-glycan and anti-OMP antibody titers at the time of the diagnosis and their variations after successful adherence of to the gluten-free diet (GFD).
Mean follow up period of 49 [10-159] mo (n = 30). Dotted lines show cut-off values for positivity.
- Citation: Papp M, Foldi I, Altorjay I, Palyu E, Udvardy M, Tumpek J, Sipka S, Korponay-Szabo IR, Nemes E, Veres G, Dinya T, Tordai A, Andrikovics H, Norman GL, Lakatos PL. Anti-microbial antibodies in celiac disease: Trick or treat? World J Gastroenterol 2009; 15(31): 3891-3900
- URL: https://www.wjgnet.com/1007-9327/full/v15/i31/3891.htm
- DOI: https://dx.doi.org/10.3748/wjg.15.3891


