Copyright
©2009 The WJG Press and Baishideng.
World J Gastroenterol. Jan 21, 2009; 15(3): 356-365
Published online Jan 21, 2009. doi: 10.3748/wjg.15.356
Published online Jan 21, 2009. doi: 10.3748/wjg.15.356
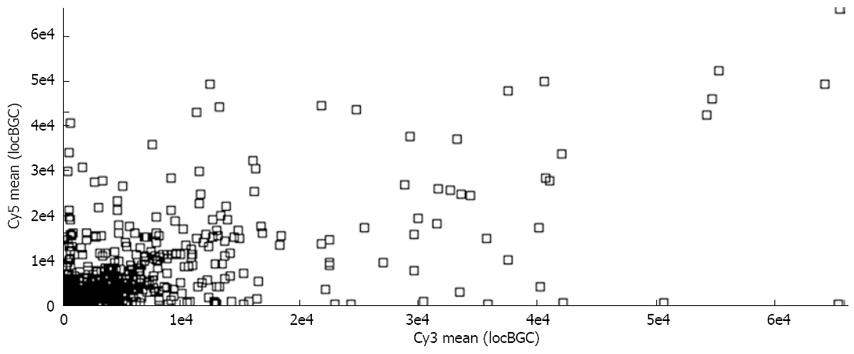
Figure 1 Scatter plots of cDNA microarray analysis.
Primary carcinoma cells (Cy3-labeled) and normal cells (Cy5-labeled) from case 20 are labeled and hybridized to the cDNA microarray.
Figure 2 A representative of cDNA microarray expression pattern obtained from case 20.
Up-, down-regulated and unchanged genes are indicated by red, green and blue spots, respectively.
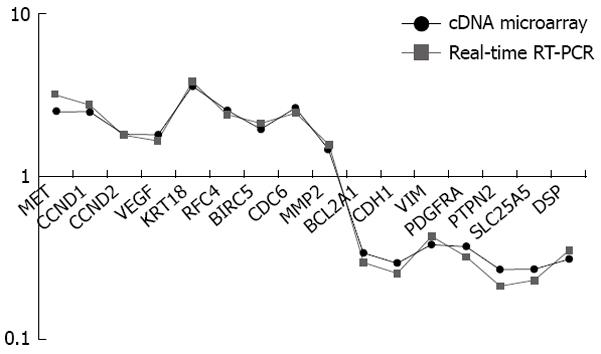
Figure 3 Relative abundance of the mRNA levels of 16 genes in one representative case (case 8), determined by cDNA microarray and real-time RT-PCR, respectively.
- Citation: Lee CF, Ling ZQ, Zhao T, Fang SH, Chang WC, Lee SC, Lee KR. Genomic-wide analysis of lymphatic metastasis-associated genes in human hepatocellular carcinoma. World J Gastroenterol 2009; 15(3): 356-365
- URL: https://www.wjgnet.com/1007-9327/full/v15/i3/356.htm
- DOI: https://dx.doi.org/10.3748/wjg.15.356


