Copyright
©2009 The WJG Press and Baishideng.
World J Gastroenterol. Jan 21, 2009; 15(3): 334-338
Published online Jan 21, 2009. doi: 10.3748/wjg.15.334
Published online Jan 21, 2009. doi: 10.3748/wjg.15.334
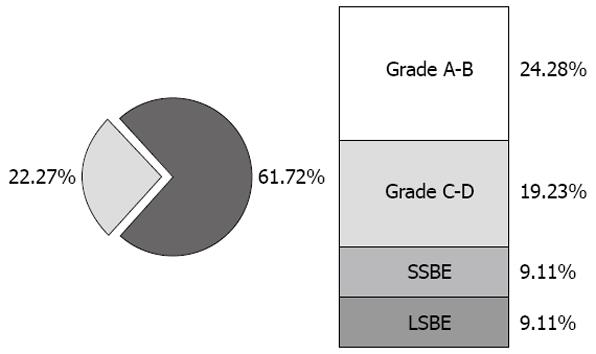
Figure 1 Endoscopy evaluation in 83 gastroesophageal reflux disease (GERD) patients.
SSBE: Short segment Barrett’s esophagus; LSBE: Long segment Barrett’s esophagus.
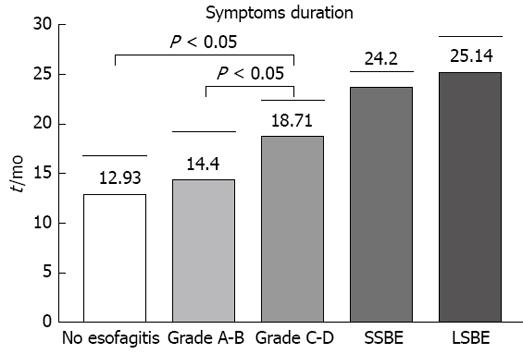
Figure 2 Symptoms.
Mean duration of symptoms history in each group of GERD patients (mean ± SD, Fisher’s exact test).
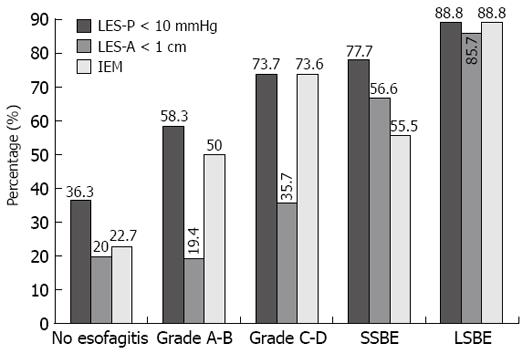
Figure 3 Manometry.
Percentage with hypotonic lower esophageal sphincter (LES), Short LES and ineffective esophageal motility in each group of GERD patients (mean ± SD, Fisher’s exact test).
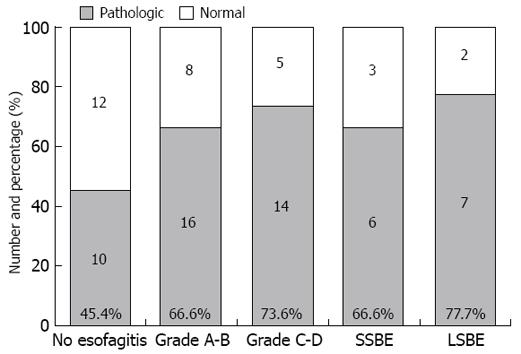
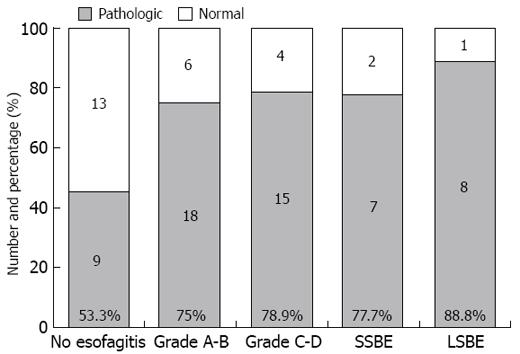
Figure 4 pH-metry.
Number and percentage of pathologic and normal pH-metry in each group of GERD patients.
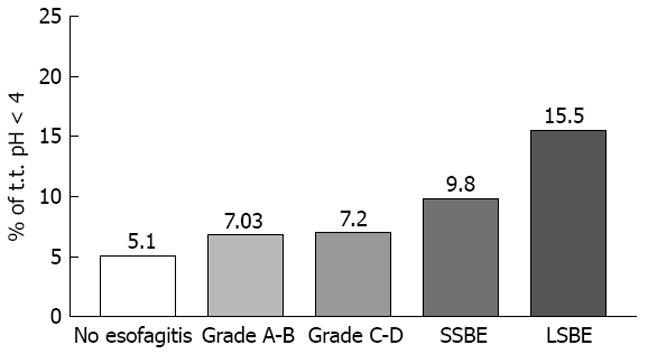
Figure 5 Esophageal acid exposure.
Mean value of total time of esophageal exposure at pH < 4 in each group of GERD patients (mean ± SD).
Figure 6 Bilimetry.
Number and percentage of pathologic and normal bilimetry in each group of GERD patients.
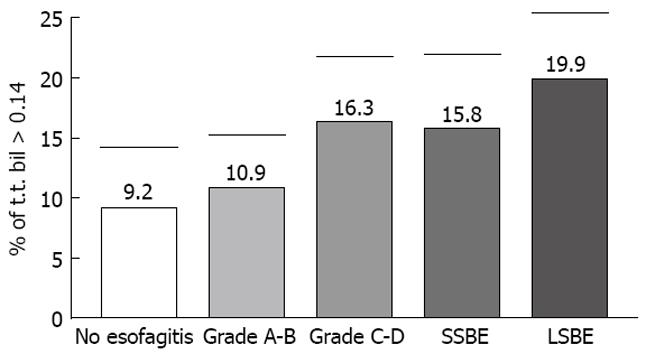
Figure 7 Esophageal bile exposure.
Mean value of total time of esophageal bilirubin absorbance > 0.14 in each group of GERD patients (mean ± SD).
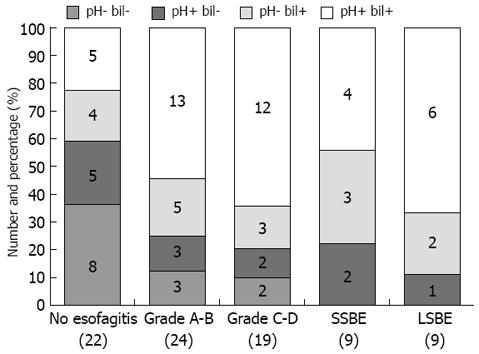
Figure 8 Combined pH-metry and bilimetry evaluation.
Number and percentage of various associations of pH-metry and bilimetry in each group of patients.
- Citation: Monaco L, Brillantino A, Torelli F, Schettino M, Izzo G, Cosenza A, Martino ND. Prevalence of bile reflux in gastroesophageal reflux disease patients not responsive to proton pump inhibitors. World J Gastroenterol 2009; 15(3): 334-338
- URL: https://www.wjgnet.com/1007-9327/full/v15/i3/334.htm
- DOI: https://dx.doi.org/10.3748/wjg.15.334


