Copyright
©2009 The WJG Press and Baishideng.
World J Gastroenterol. Jun 14, 2009; 15(22): 2731-2738
Published online Jun 14, 2009. doi: 10.3748/wjg.15.2731
Published online Jun 14, 2009. doi: 10.3748/wjg.15.2731
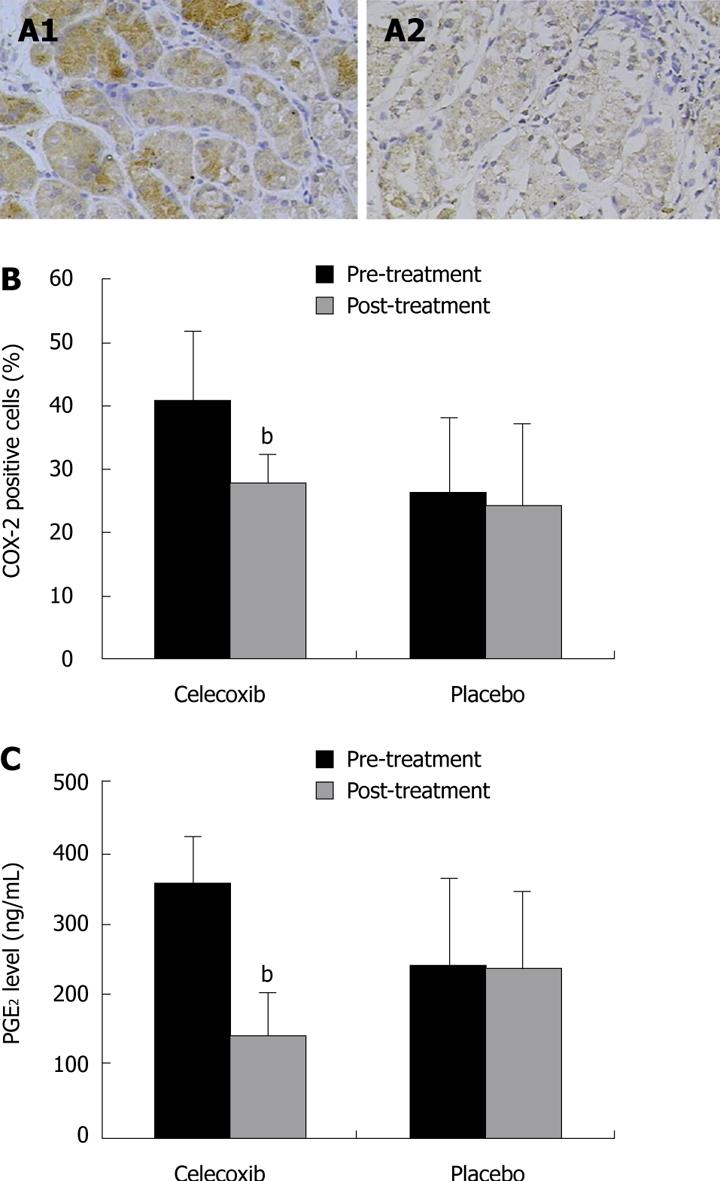
Figure 1 Effects of celecoxib on COX-2 expression and PGE2 levels.
A: Representative image of COX-2 protein expression as determined by immunostaining in paraffin-embedded gastric tissue sections: (A1) pre-treatment, and (A2) post-treatment with celecoxib; B: Percentage of COX-2 positive cells in gastric mucosa; C: PGE2 levels. Data are mean ± SD. bP < 0.001.
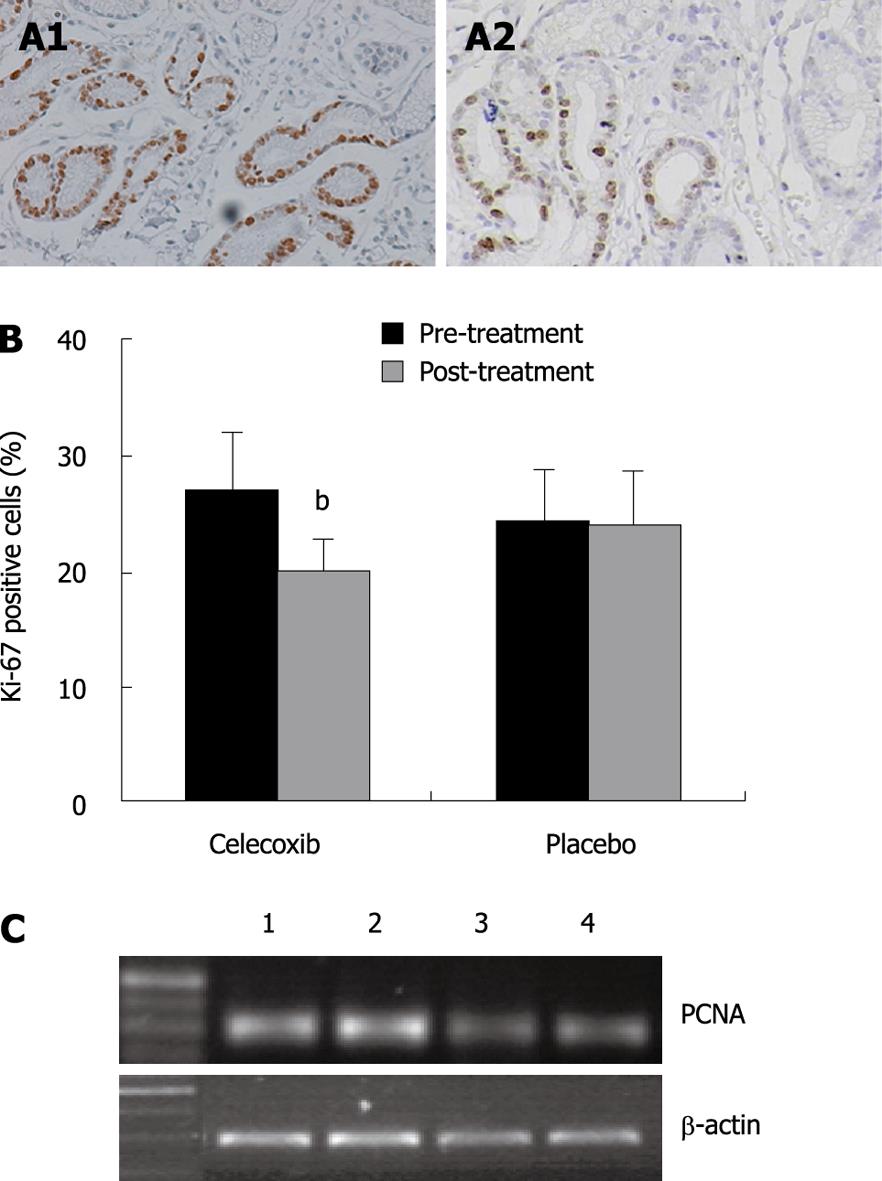
Figure 2 Effects of celecoxib on cell proliferation.
A: Representative Ki-67 staining of gastric mucosa before (A1) and after treatment (A2) with celecoxib; B: Celecoxib led to a significant reduction in proliferation index (PI); C: Celecoxib down-regulated mRNA expression of proliferation cell nuclear antigen (PCNA). 1 and 2: Plecebo; 3 and 4: Celecoxib. Data are mean ± SD. bP < 0.01.
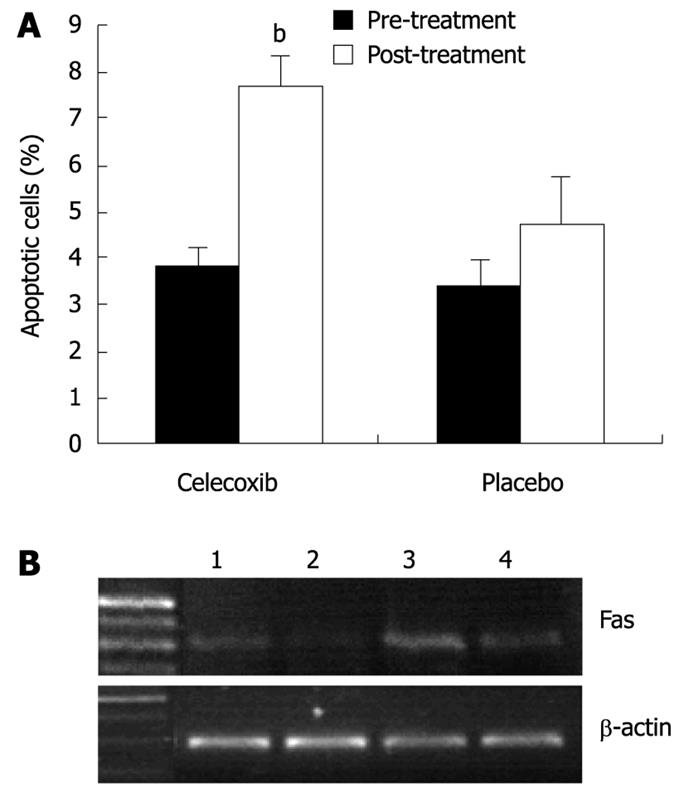
Figure 3 Effects of celecoxib on cell apoptosis.
A: Celecoxib induced the apoptosis index (AI) in gastric mucosa; B: Celecoxib up-regulated mRNA expression of Fas, a pro-apoptosis gene. 1 and 2: Plecebo; 3 and 4: Celecoxib. Data are mean ± SD. bP < 0.01.
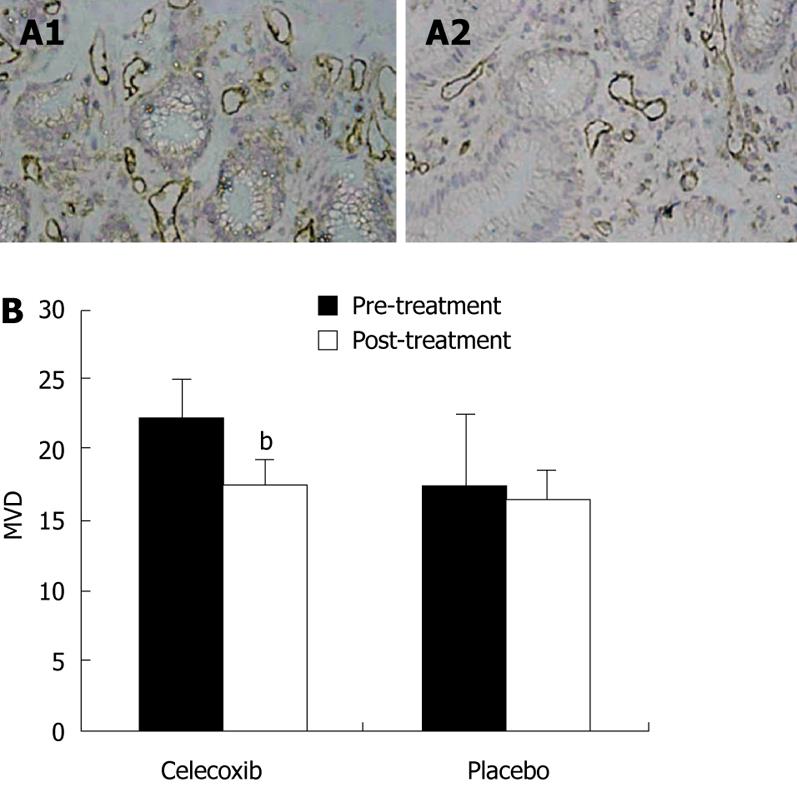
Figure 4 Effects of celecoxib on angiogenesis.
A: Representative microvessel image of paraffin-embedded gastric tissue sections stained with CD31. (A1) pre-treatment, and (A2) post-treatment with celecoxib; B: Celecoxib suppressed microvessel density (MVD). Data are mean ± SD. bP < 0.001.
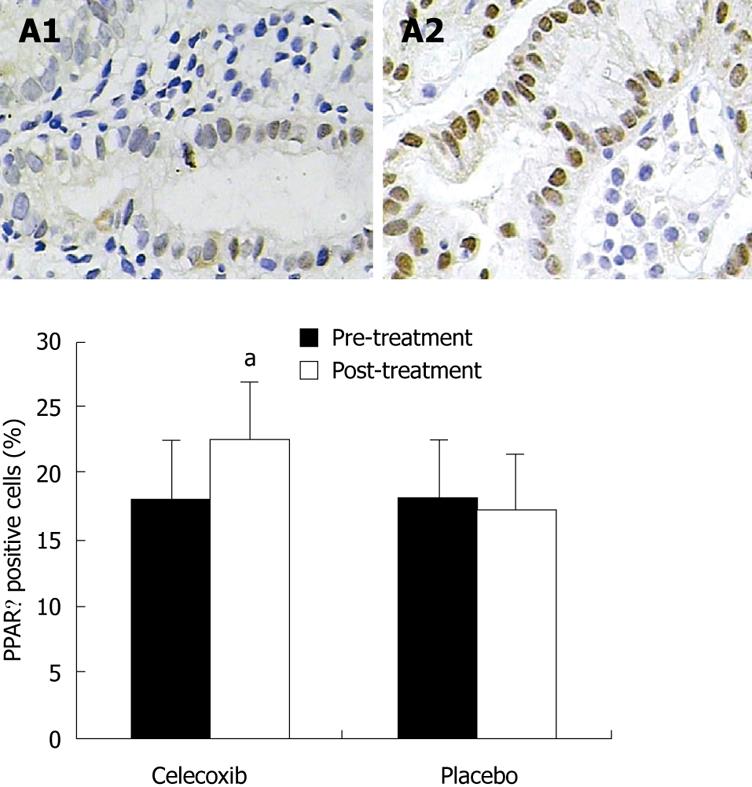
Figure 5 Effects of celecoxib on PPARγ protein expression.
Representative PPARγ expression in paraffin-embedded gastric tissue sections by immunostaining. (A1) pre-treatment, and (A2) post-treatment with celecoxib. Nuclear staining of PPARγ was markedly increased post-treatment with celecoxib. aP < 0.05.
-
Citation: Zhang LJ, Wang SY, Huo XH, Zhu ZL, Chu JK, Ma JC, Cui DS, Gu P, Zhao ZR, Wang MW, Yu J. Anti-
Helicobacter pylori therapy followed by celecoxib on progression of gastric precancerous lesions. World J Gastroenterol 2009; 15(22): 2731-2738 - URL: https://www.wjgnet.com/1007-9327/full/v15/i22/2731.htm
- DOI: https://dx.doi.org/10.3748/wjg.15.2731


