Copyright
©2009 The WJG Press and Baishideng.
World J Gastroenterol. Jun 7, 2009; 15(21): 2609-2616
Published online Jun 7, 2009. doi: 10.3748/wjg.15.2609
Published online Jun 7, 2009. doi: 10.3748/wjg.15.2609
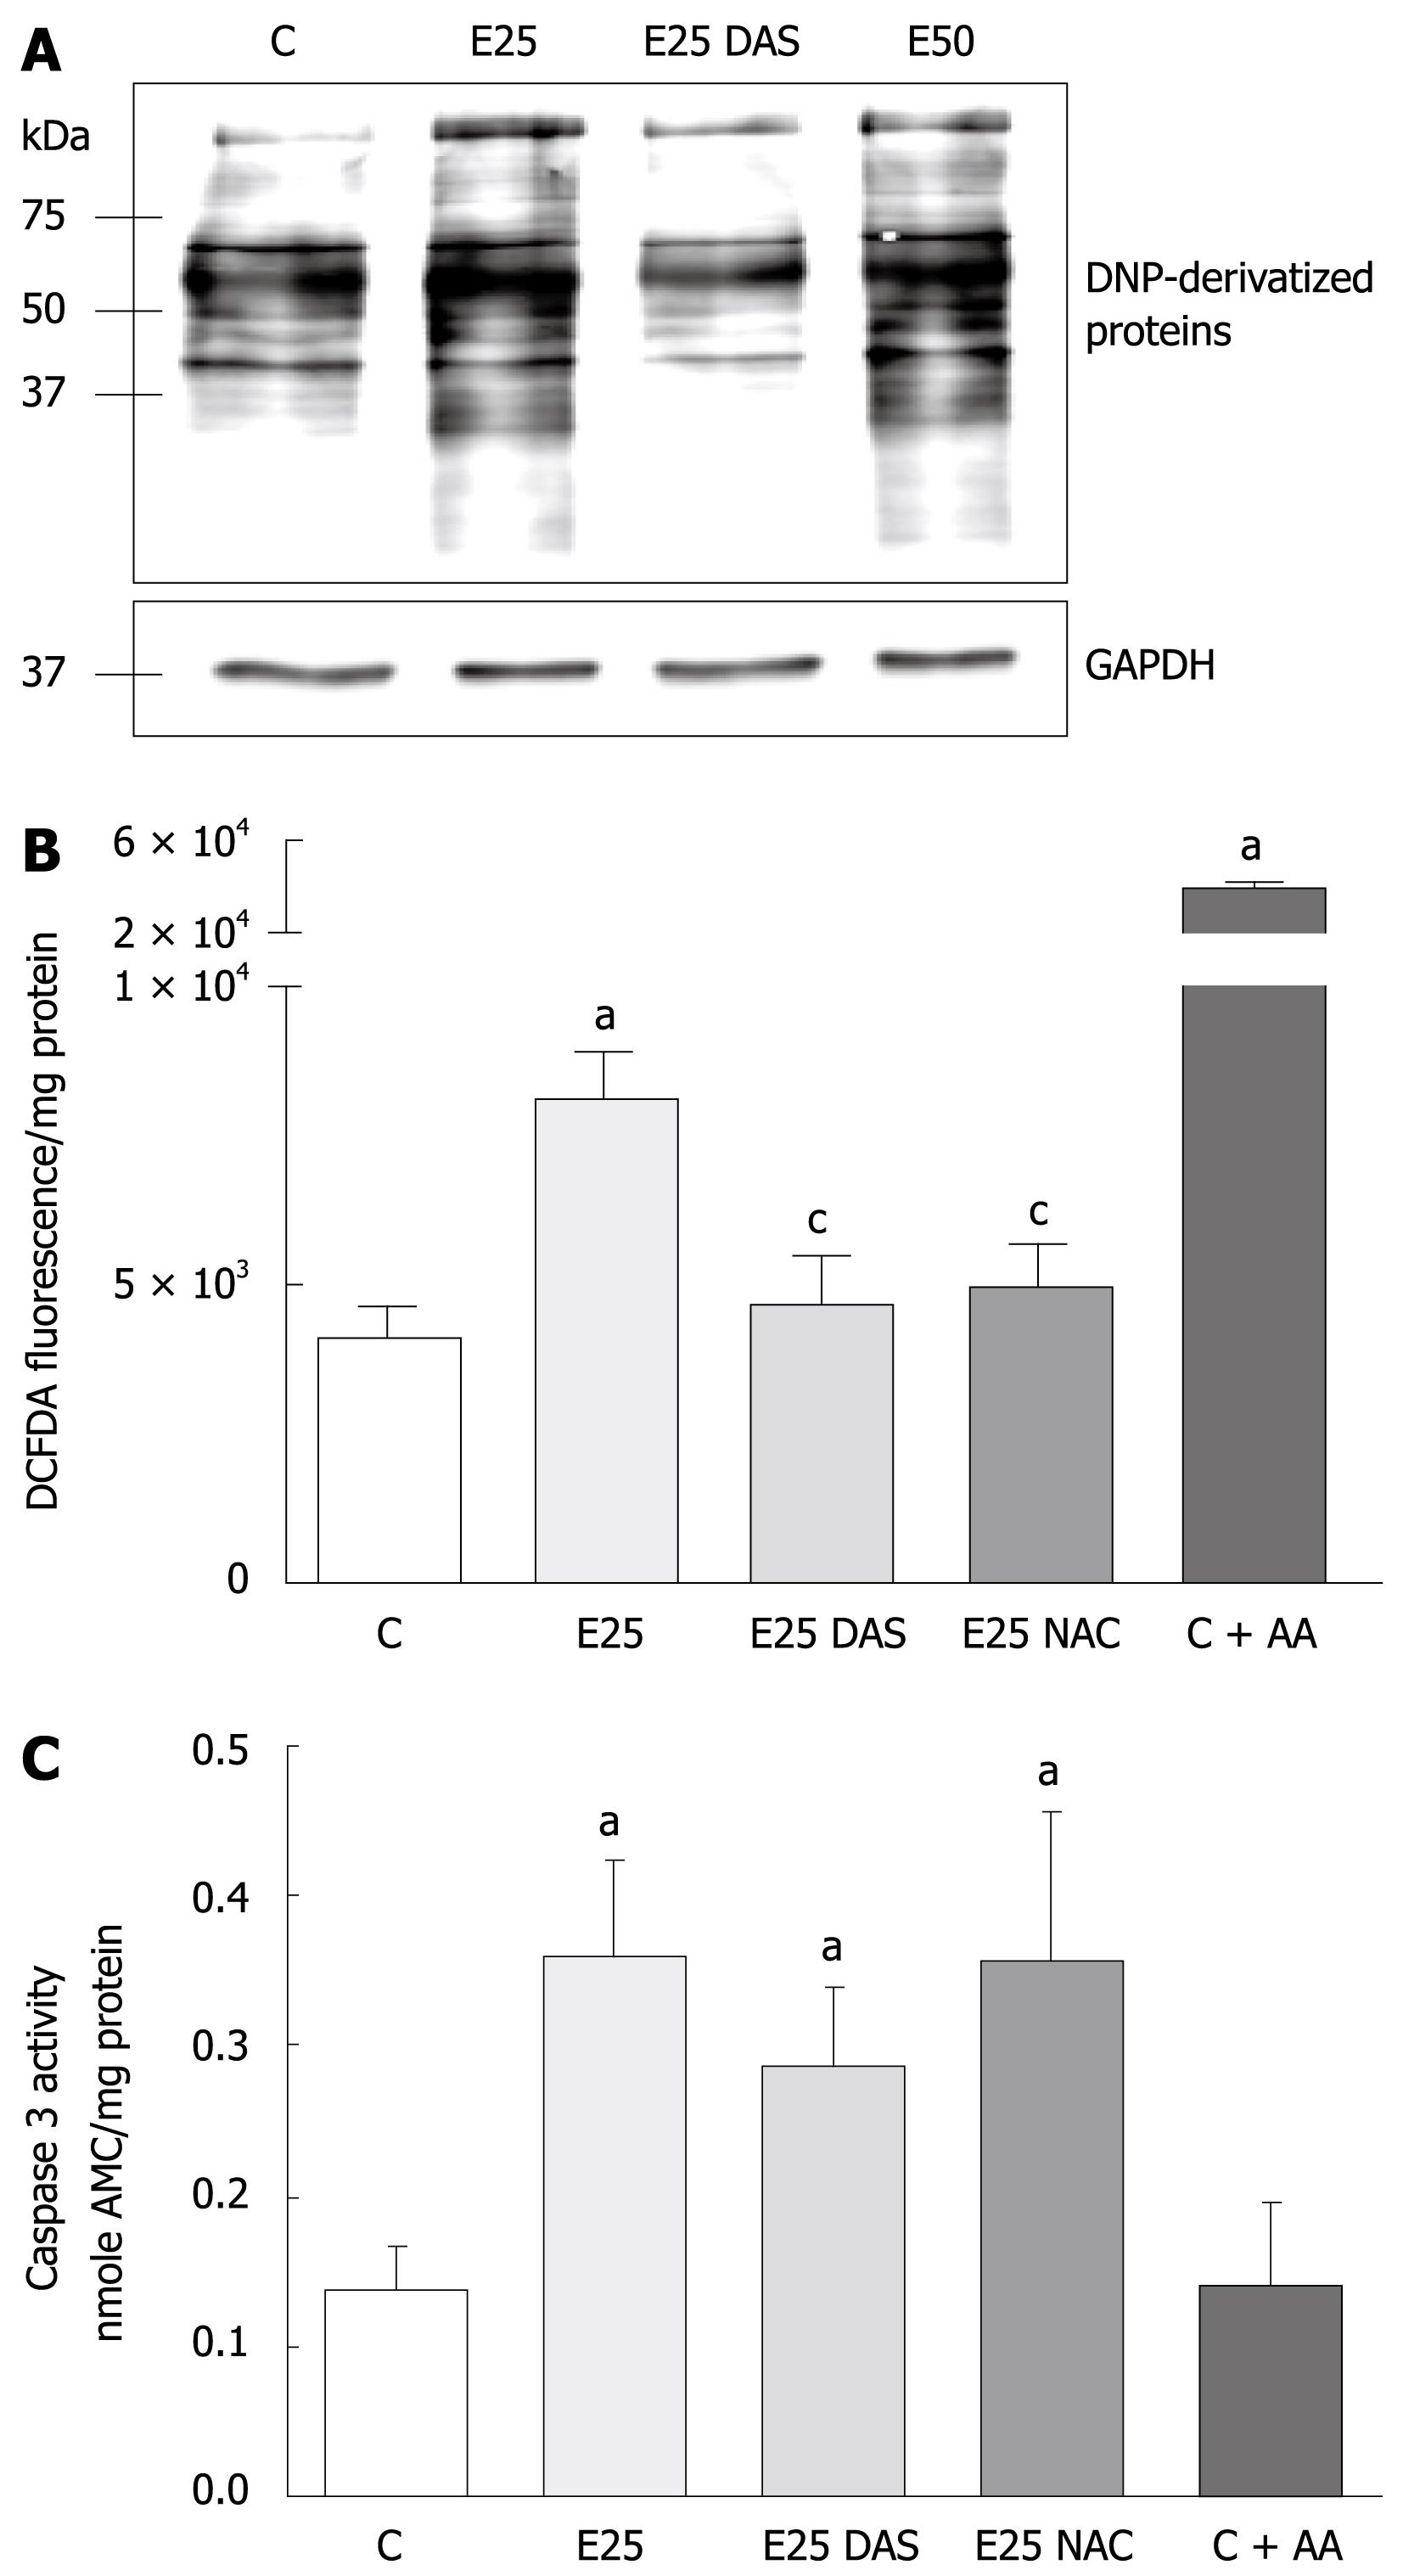
Figure 1 Ethanol-induced protein oxidation, oxidative stress, and caspase activation in WIF-B cells.
WIF-B cultures were cultured for 48 h in the absence or presence of ethanol, and DAS or NAC when indicated. As a positive control for H2O2 production, some cultures were treated with 2 &mgr;mol/L Antimycin A (C + AA) for 30 min prior to analysis. A: Protein oxidation analysis represented as DNP-specific proteins detected in WIF-B cell lysates using the OxyBlot protein oxidation analysis; B: H2O2 production was detected by dichlorofluorescein fluorescence quantification. Data from 5 independent experiments is represented as the amount of fluorescent (DCFDA) oxidized products detected in the treated cells per mg protein; C: The activation of the proapoptotic protease, caspase-3, was detected as described in “Material and Methods” for five independent experiments. aP < 0.05 vs control; cP < 0.05 vs ethanol alone-treated cells.
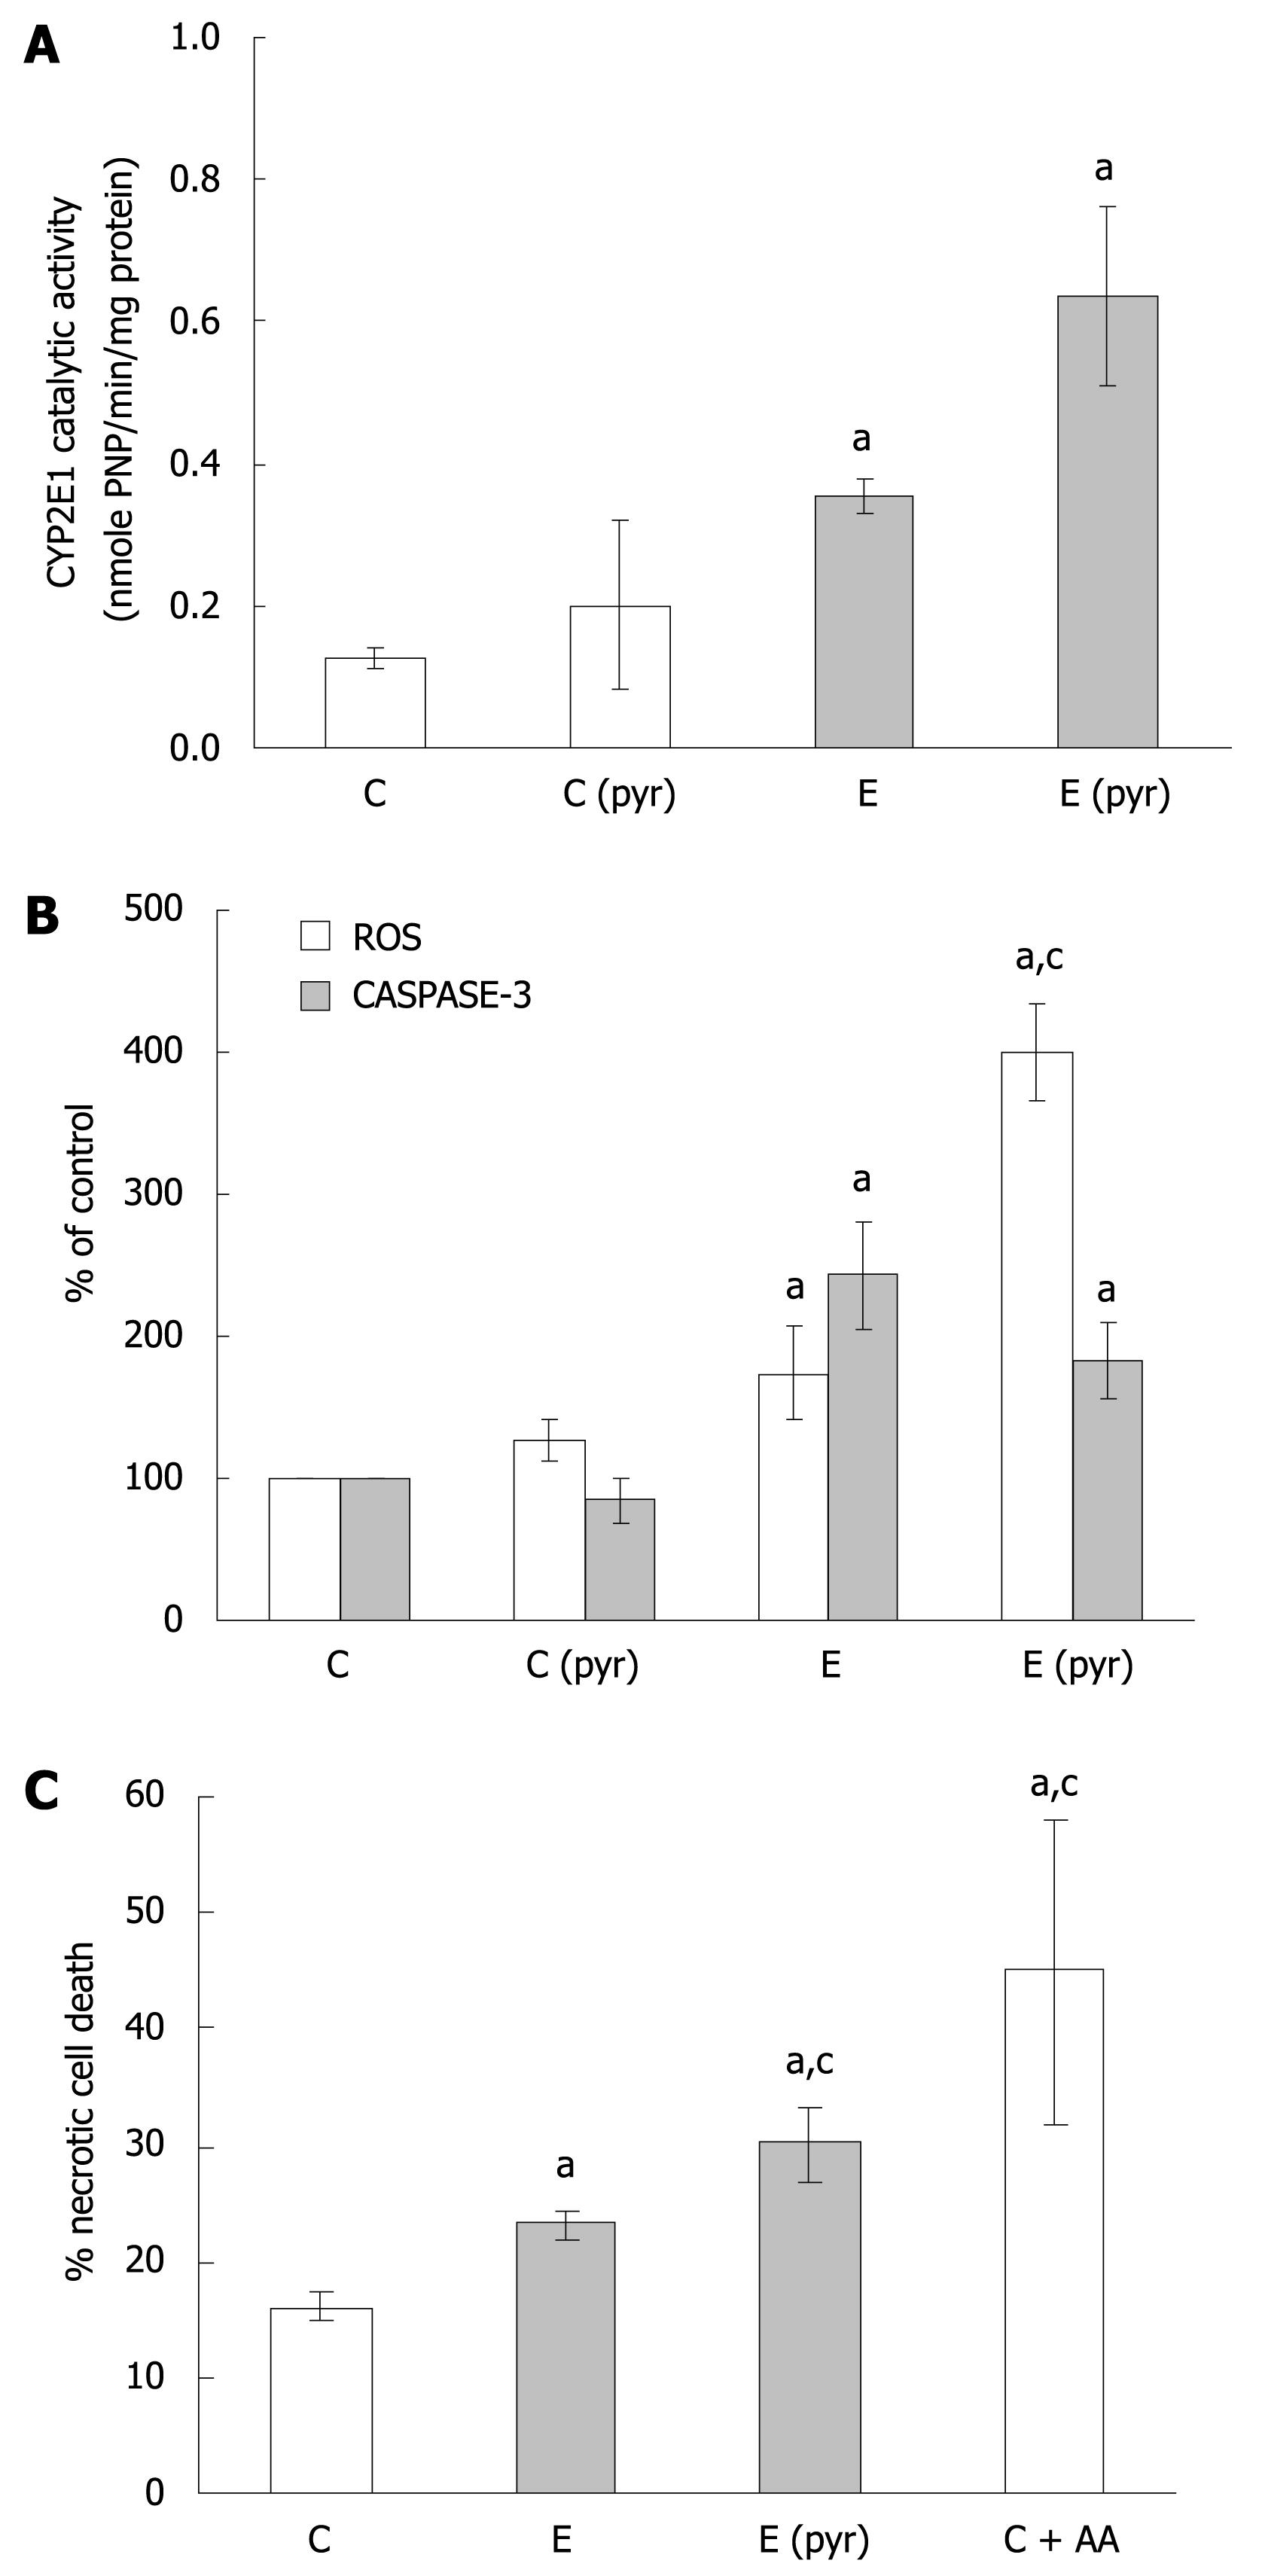
Figure 2 The relationship of CYP2E1 expression, oxidative stress, and WIF-B cell death following ethanol administration.
WIF-B cultures were treated without (C) or with pyrazole (Cpyr) for 4 d followed by ethanol treatment for 48 h [E and E (pyr)]. A: CYP2E1 activity in isolated microsomes analyzed using the r-nitophenol oxidation assay in four independent experiments; B: H2O2 production representative of ROS generation detected by dichlorofluorescein production, and the activation of caspase-3 as a measure of apoptosis from seven independent experiments; C: Necrotic cell death evaluated by flow cytometric analysis in three independent experiments using the LIVE/DEAD cell stain as described in “Material and Methods”. aP < 0.05 vs control; cP < 0.05 vs ethanol alone-treated cells.
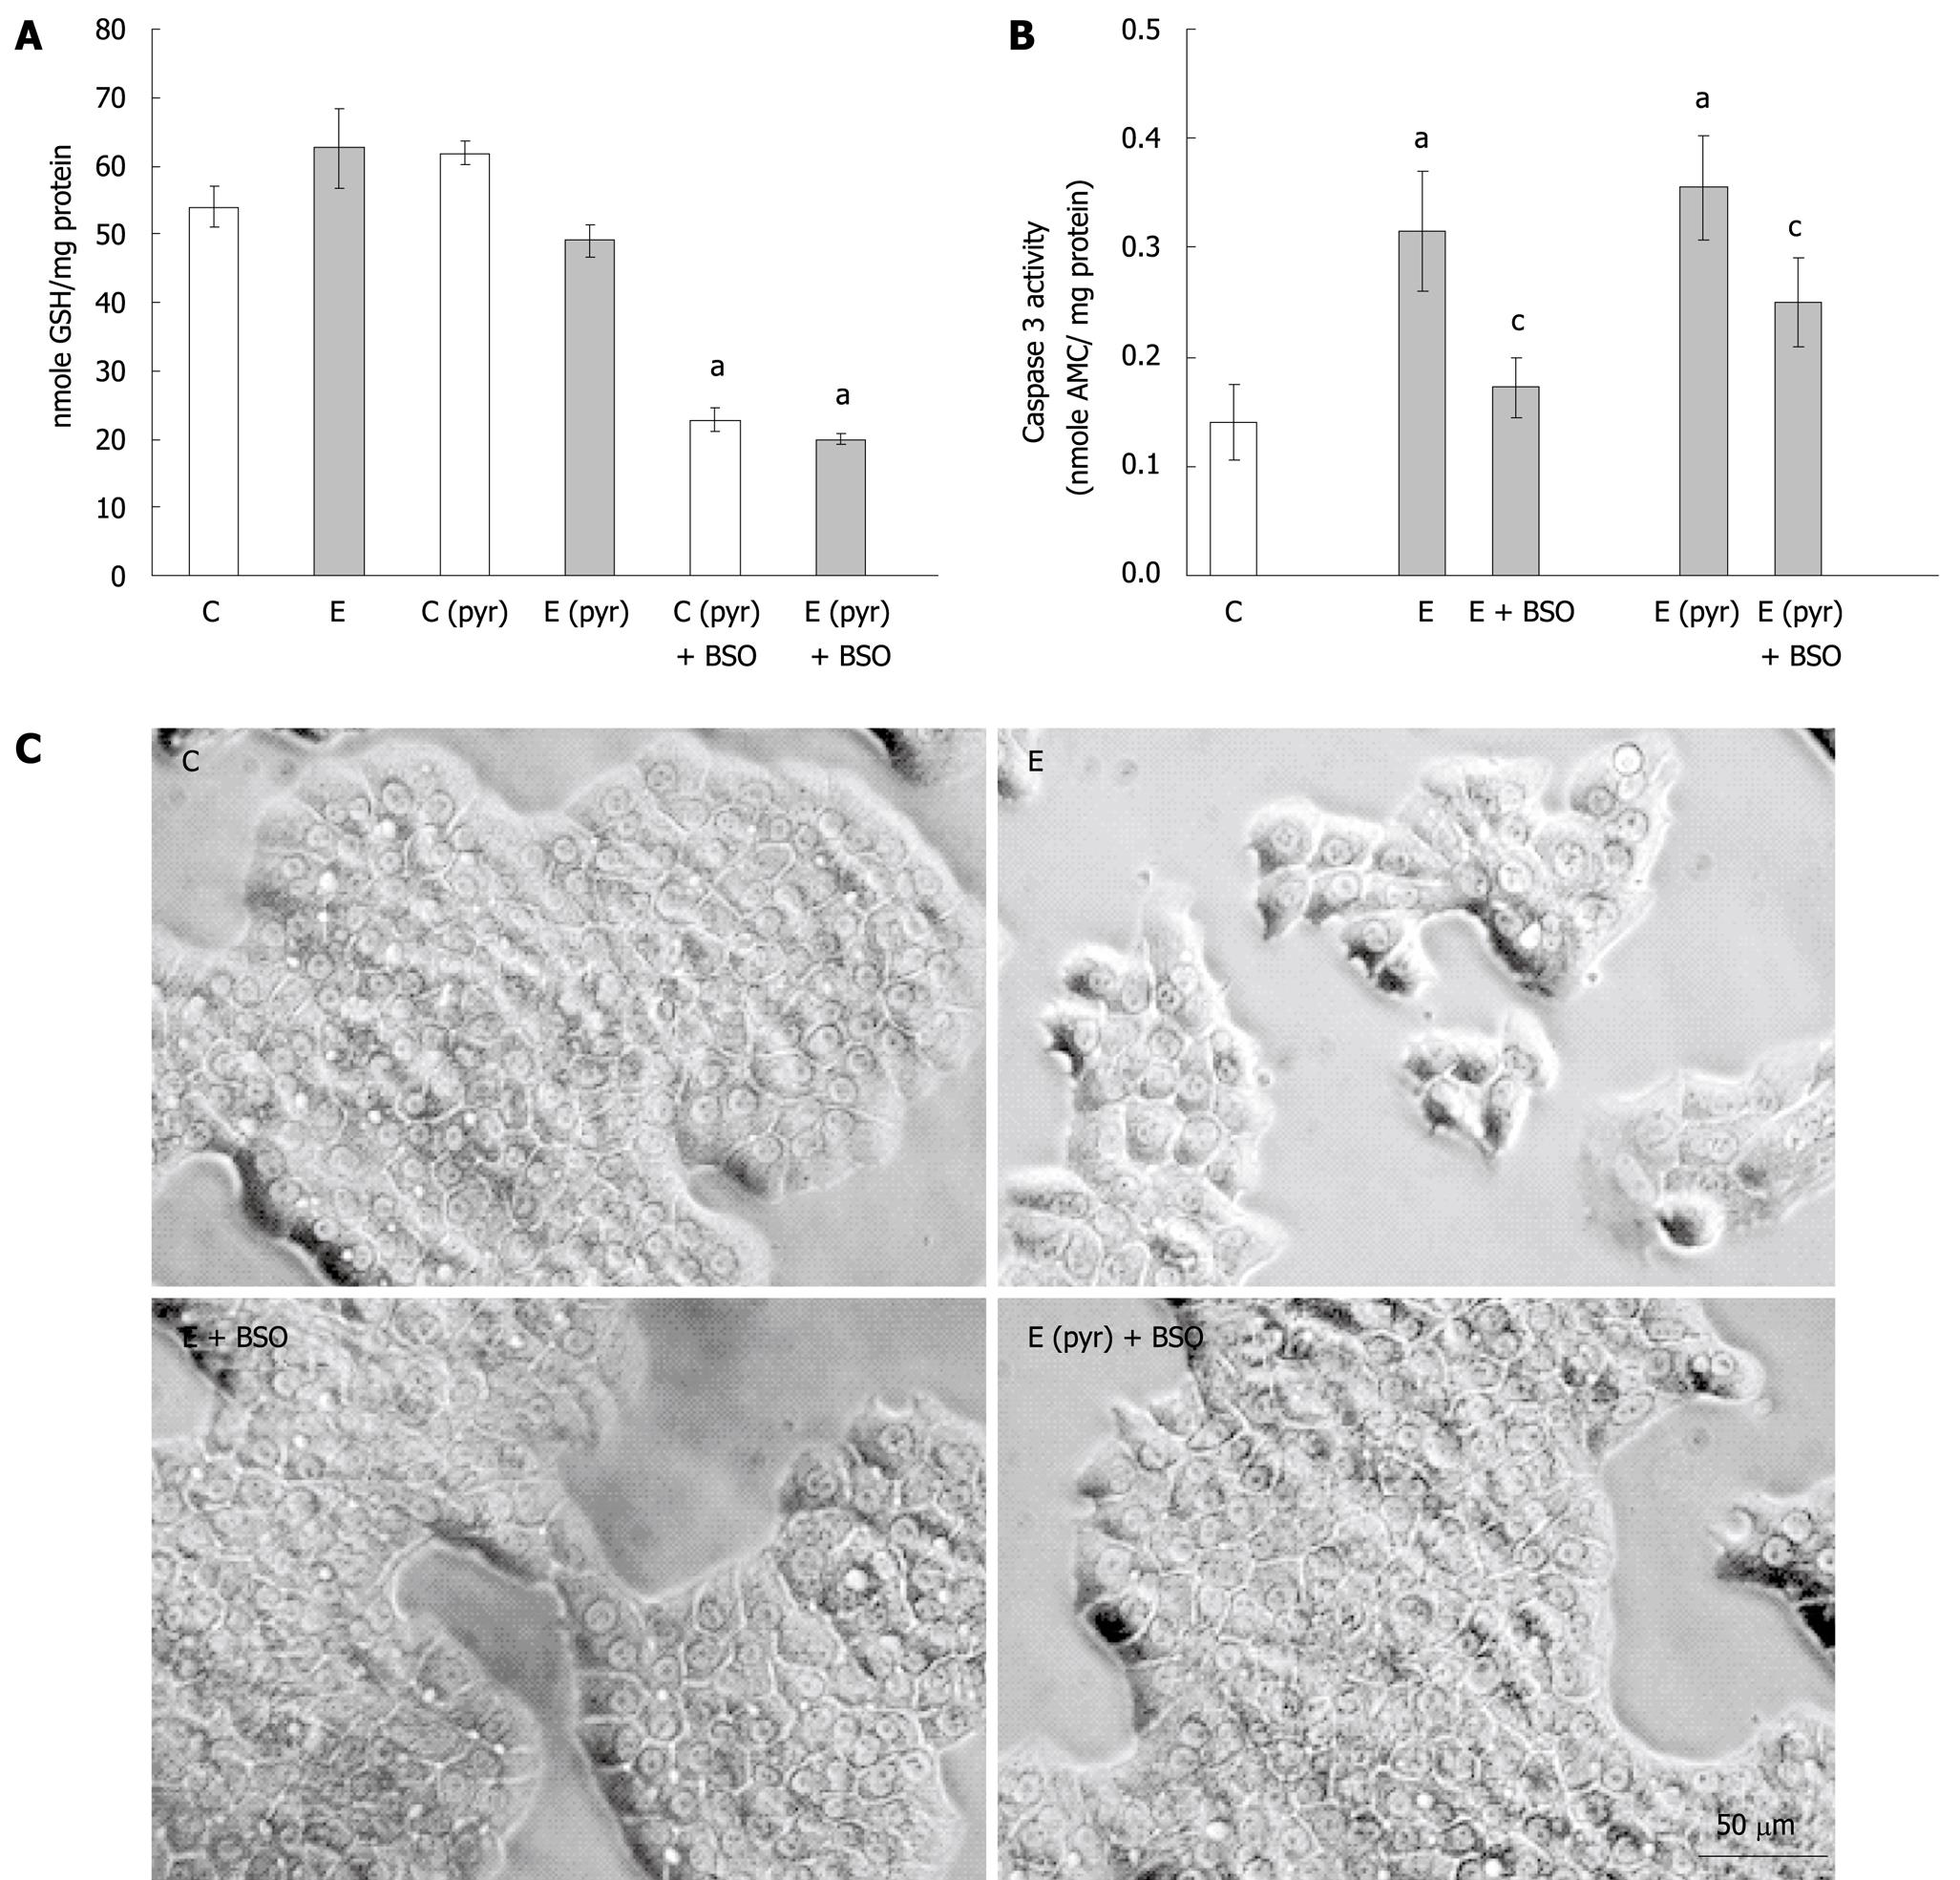
Figure 3 The effect of glutathione depletion on the induction of caspase activation in ethanol-treated WIF-B cells.
WIF-B cultures were treated in the presence or absence of ethanol (25 mmol/L) for 48 h after pretreatment with (C pyr and E pyr) or without (C and E) pyrazole. Glutathione was depleted by the inclusion of BSO in the culture media when indicated (+ BSO). A: The amount of reduced glutathione (GSH) was detected as described in “Material and Methods”; B: Measure of apoptosis in WIF-B cells following glutathione depletion. Cell lysates were assayed for caspase-3 activity and the release of fluorescent product was detected and expressed for five independent experiments; C: Phase contrast images of the treated WIF-B cultures. aP < 0.05 vs control; cP < 0.05 vs ethanol-treated.
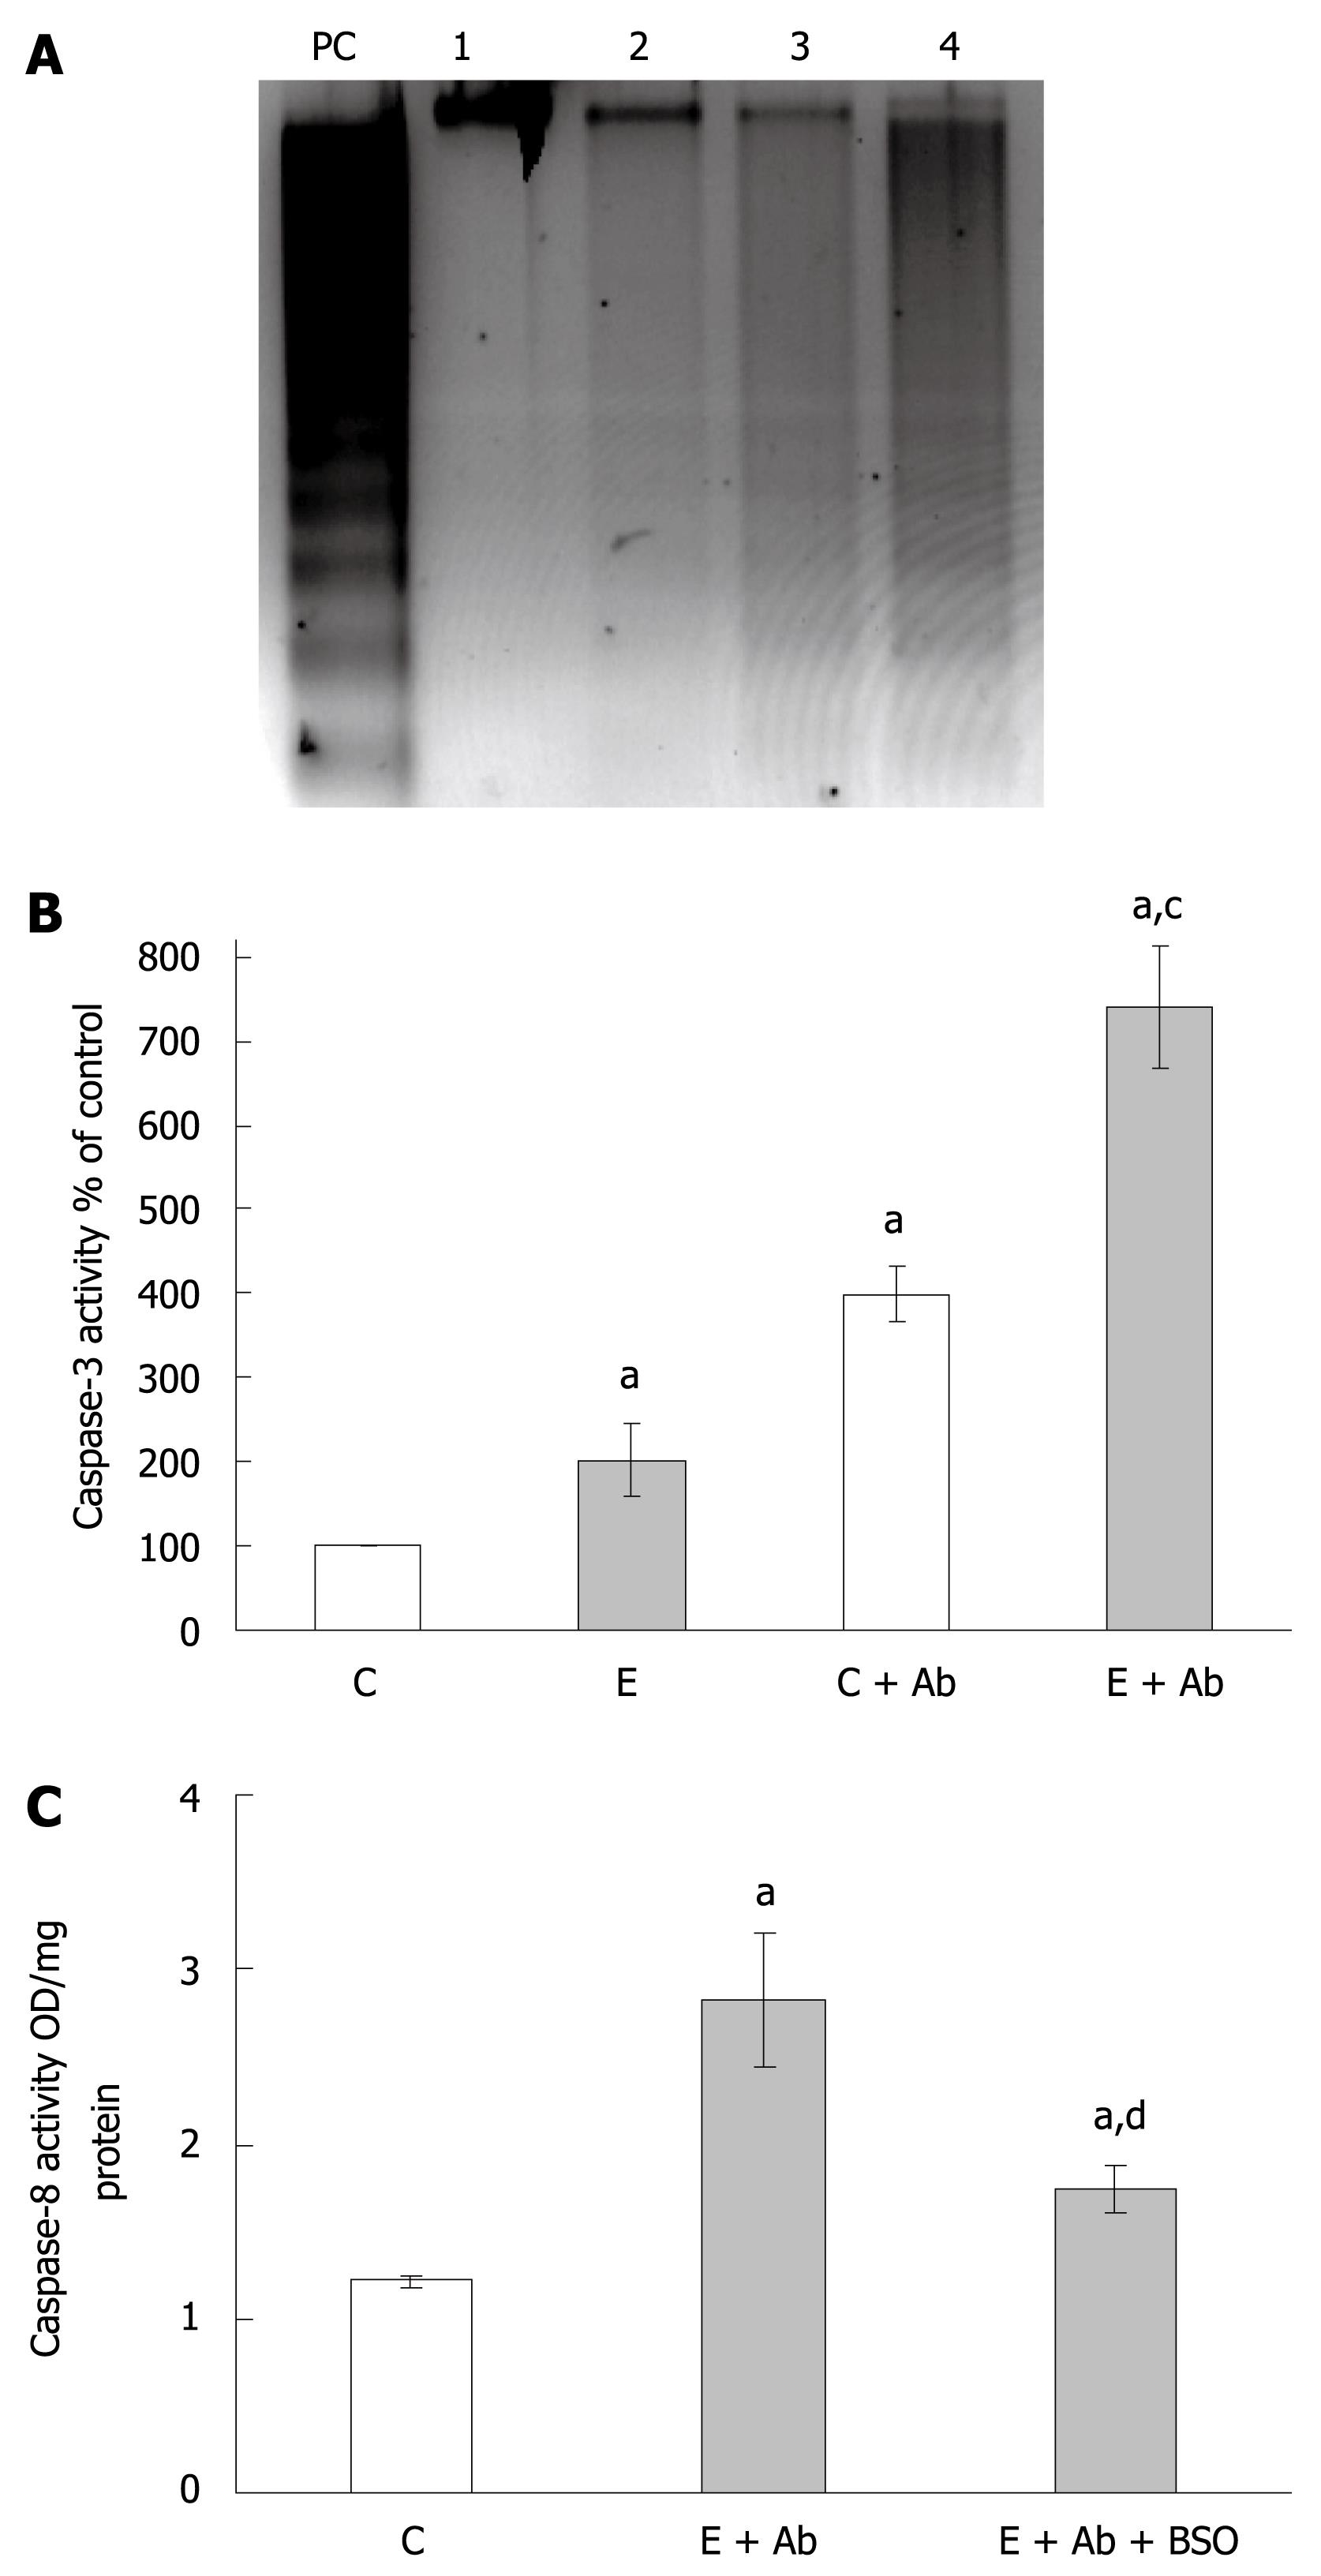
Figure 4 Fas-mediated apoptosis following ethanol administration and the effects of BSO treatment.
A: Representative gel depicting apoptosis identified by DNA fragmentation. WIF-B cultures were left untreated or treated with 25 mmol/L ethanol for 24 h prior to challenge with anti-Fas antibody/Act D (Ab) for 16 h. The samples represented are untreated control cells (lane 1), ethanol alone-treated cells (lane 2), control cells incubated with Ab (lane 3), and ethanol-treated cells incubated with Ab (lane 4). UV-treated WIF-B cells were used as a positive control (lane PC); B: The analysis of caspase-3 activation following Fas antibody treatments. WIF-B cells were cultured for 24 h in the absence and presence of ethanol followed by the additional overnight incubation with Ab as described above. The activity of caspase-3 was assayed in four independent experiments as previously described; C: The effect of glutathione depletion by BSO on caspase-8 activation. WIF-B cultures were treated with ethanol and Fas antibody with or without the inclusion of BSO. The activity of caspase-8 was determined in three independent experiments as described in “Material and Methods”. aP < 0.05 vs untreated control cells; cP < 0.05 vs corresponding controls; dP < 0.05 vs cells treated with ethanol plus Ab.
- Citation: McVicker BL, Tuma PL, Kharbanda KK, Lee SM, Tuma DJ. Relationship between oxidative stress and hepatic glutathione levels in ethanol-mediated apoptosis of polarized hepatic cells. World J Gastroenterol 2009; 15(21): 2609-2616
- URL: https://www.wjgnet.com/1007-9327/full/v15/i21/2609.htm
- DOI: https://dx.doi.org/10.3748/wjg.15.2609


