Copyright
©2009 The WJG Press and Baishideng.
World J Gastroenterol. Jan 14, 2009; 15(2): 131-138
Published online Jan 14, 2009. doi: 10.3748/wjg.15.131
Published online Jan 14, 2009. doi: 10.3748/wjg.15.131
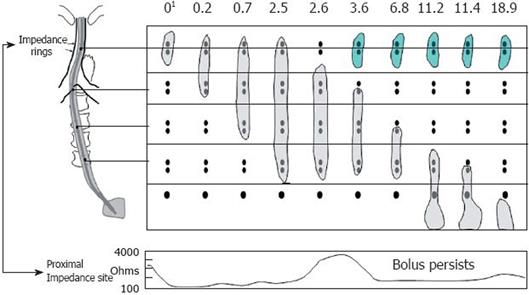
Figure 1 Example of retrograde escape and proximal stasis on simultaneous multichannel intraluminal impedance and fluoroscopy.
The fluoroscopic bolus is represented by the gray bolus at each time interval during the swallow and the green bolus during retrograde escape. The bottom panel is a single impedance tracing at the proximal location. The bolus is present at the proximal impedance site until 2.6 s where the bolus tails moves distal to the two rings at that level and the impedance tracing returns to baseline. At 3.6 s, the bolus (green) reenters the recording site and once again the impedance drops consistent with bolus retention. Modified from Imam et al[7]. 1Time in seconds.
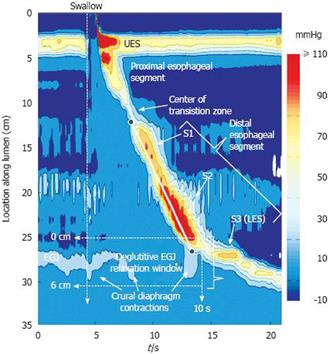
Figure 2 Typical swallow pressure topography spanning from the pharynx (locations 0-2 cm) to stomach (locations 29-35 cm) of a normal subject with normal peristalsis and normal EGJ relaxation.
The transition zone, demarcating the end of the proximal esophageal segment (striated muscle) and the beginning of the distal esophageal segment (smooth muscle), is readily identified as a pressure minimum. Note that the distal segment, in fact, has three sub-segments (S1, S2, S3) within it, each with an identifiable pressure peak. Sub-segment 3, the LES, contracts at the termination of peristalsis and then descends back to the level of the CD as the period of swallow-related esophageal shortening ends. The onset of the deglutitive relaxation window is at the onset of upper sphincter relaxation while the offset is 10 s later. The spatial domain within which EGJ relaxation is assessed (the eSleeve™ range) is user defined, spanning at least 6 cm, depending on the extent of esophageal shortening after the swallow. The contractile front velocity (CFV) is the slope of the line connecting the black circle-points on the 30 mmHg isobaric contour at the proximal margin of S1 and the distal margin of S2.
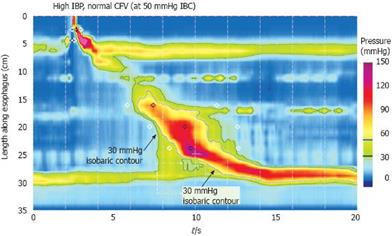
Figure 3 Defining increased intrabolus pressure using high-resolution manometry.
The figure illustrates a swallow with functional obstruction at the EGJ. Note that the 30 mmHg isobaric contour line (black) deviates quickly from the 50 mmHg isobaric contour line (blue). In this case, the contractile front velocity is normal, reflecting the propagation velocity of 50 mmHg isobaric contour rather than the 30 mmHg isobaric contour. The intrabolus pressure domain is defined by the compartmentalized pressurization between the propagating contraction and the EGJ. Modified from: Pandolfino et al[26].
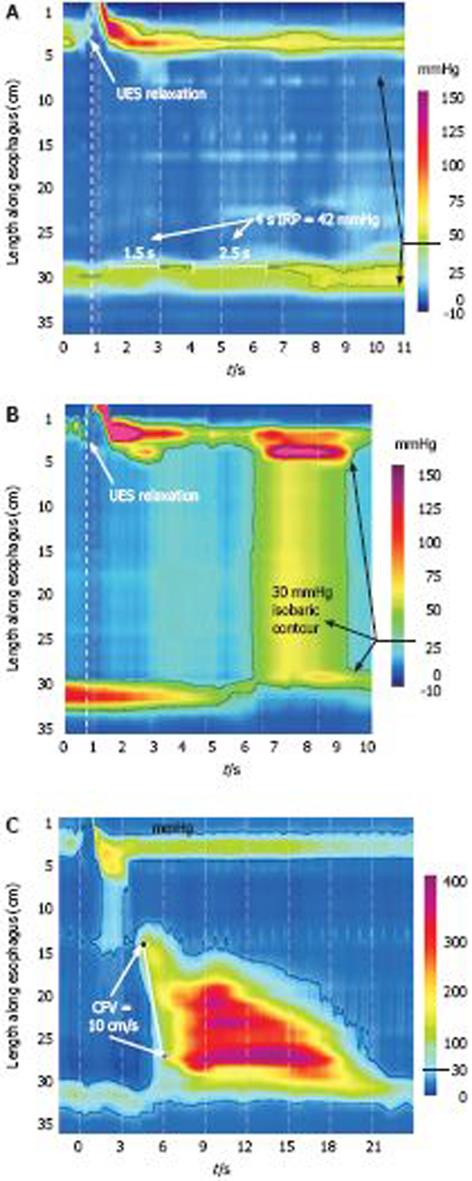
Figure 4 Achalasia subtypes based on manometric patterns of esophageal body contractility.
A: Classic achalasia. There is no significant pressurization within the body of the esophagus and there is concurrent impaired EGJ relaxation (IRP of 42 mmHg in this example);Achalasia subtypes based on manometric patterns of esophageal body contractility. B: Achalasia with compression. This subtype exhibits a rapid pan-esophageal pressurization;Achalasia subtypes based on manometric patterns of esophageal body contractility. C: Spastic Achalasia. Although this swallow is associated with rapidly propagated pressurization, the pressurization in this case is attributable to an abnormal lumen obliterating contraction. Modified from: Pandolfino et al[26].
- Citation: Pandolfino JE, Kahrilas PJ. New technologies in the gastrointestinal clinic and research: Impedance and high-resolution manometry. World J Gastroenterol 2009; 15(2): 131-138
- URL: https://www.wjgnet.com/1007-9327/full/v15/i2/131.htm
- DOI: https://dx.doi.org/10.3748/wjg.15.131


