Copyright
©2009 The WJG Press and Baishideng.
World J Gastroenterol. May 21, 2009; 15(19): 2406-2411
Published online May 21, 2009. doi: 10.3748/wjg.15.2406
Published online May 21, 2009. doi: 10.3748/wjg.15.2406
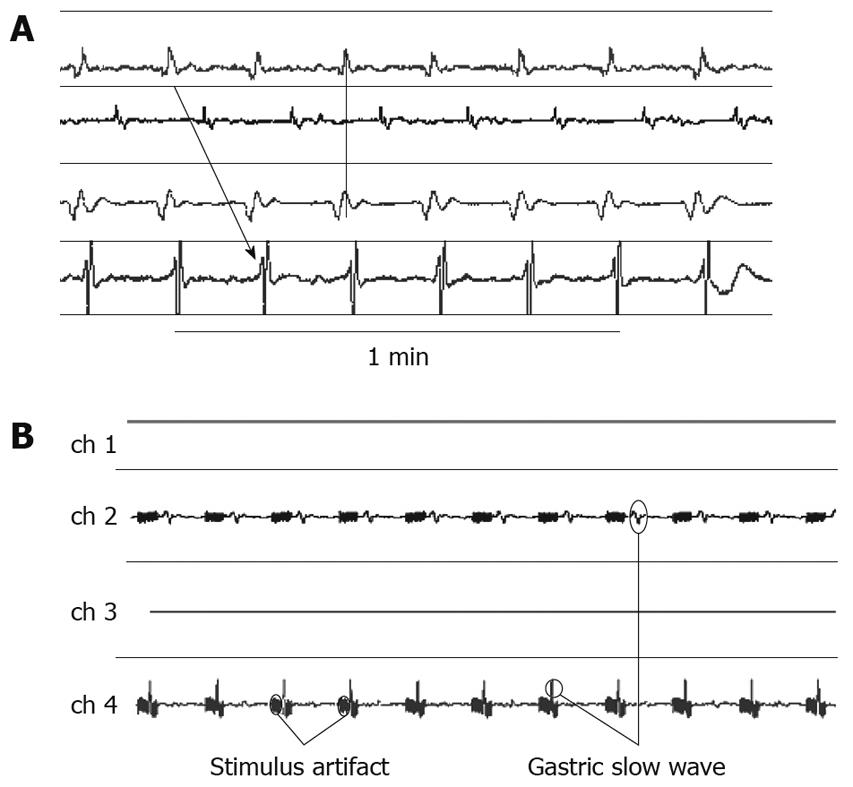
Figure 1 Gastric slow waves at the baseline and with two-channel GES (A), and recordings of gastric slow waves at baseline during 2-channel GES via the first and third channels (B).
Figure 2 Experiment protocol.
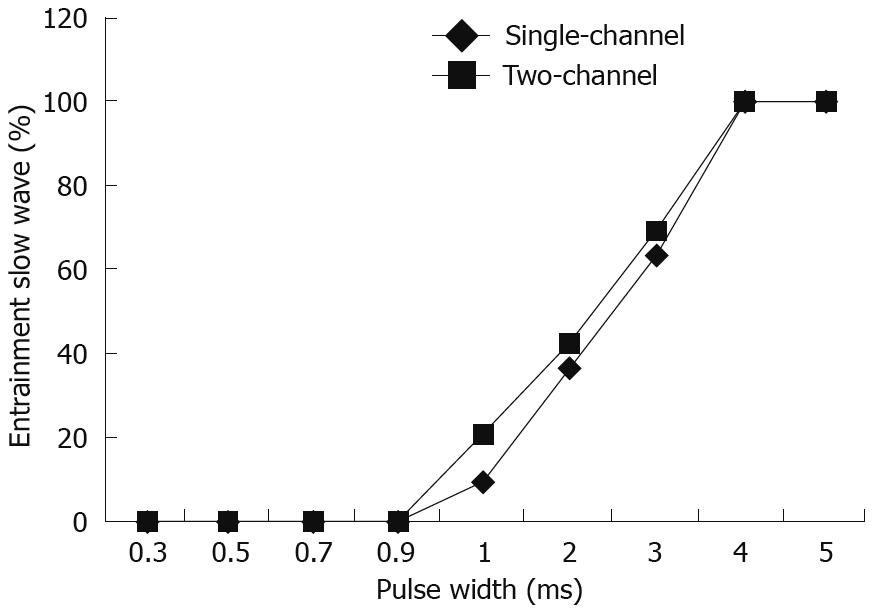
Figure 3 Percentage of slow wave entrainment with GES as a function of stimulation pulse width.
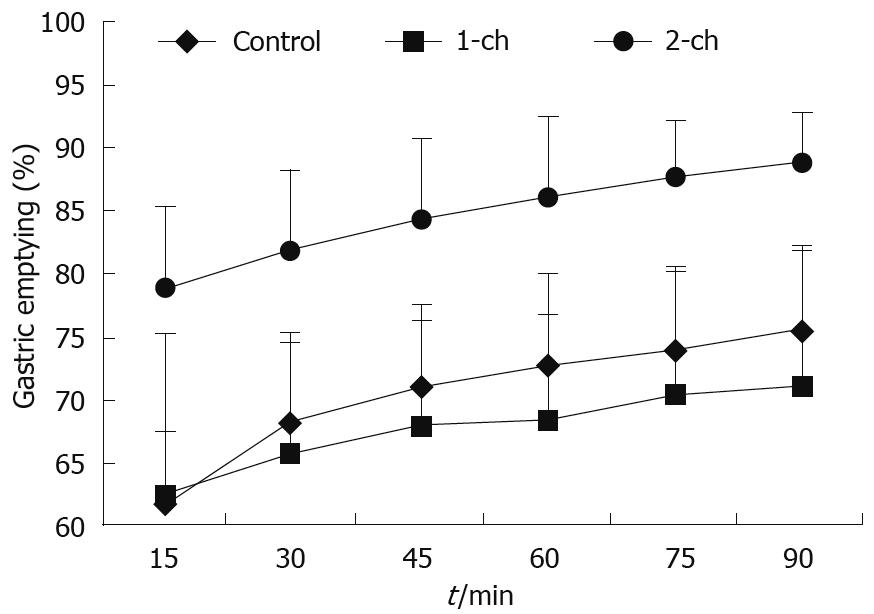
Figure 4 Gastric emptying in the control sessions and sessions with single-channel or two-channel GES.
P < 0.01 (2-ch vs control).
- Citation: Yang B, Hou XH, Song GQ, Liu JS, Chen JD. Effect of two-channel gastric electrical stimulation with trains of pulses on gastric motility. World J Gastroenterol 2009; 15(19): 2406-2411
- URL: https://www.wjgnet.com/1007-9327/full/v15/i19/2406.htm
- DOI: https://dx.doi.org/10.3748/wjg.15.2406


