Copyright
©2009 The WJG Press and Baishideng.
World J Gastroenterol. May 21, 2009; 15(19): 2389-2394
Published online May 21, 2009. doi: 10.3748/wjg.15.2389
Published online May 21, 2009. doi: 10.3748/wjg.15.2389
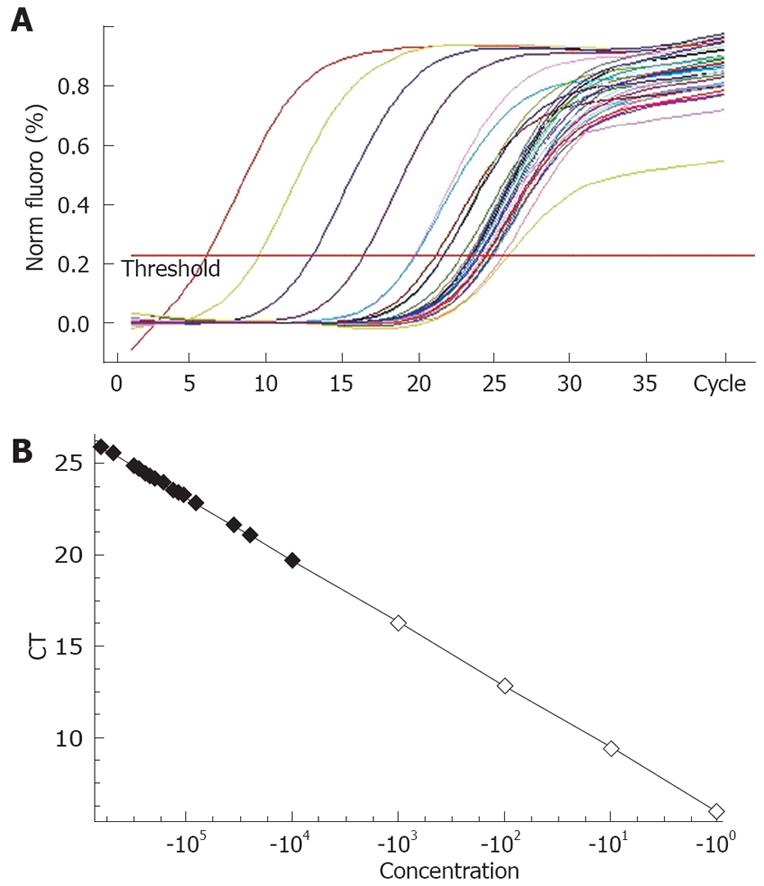
Figure 1 Amplification curve (A) and standard curve (B) of quantitative real-time PCR for Bmi1 mRNA.
Total RNA was extracted for subsequent reverse transcription, and standard cDNA was serially diluted to obtain five standard solutions (1 × 10⁻¹, 1 × 10⁻², 1 × 10⁻³, 1 × 10⁻⁴, 1 × 10⁻⁵) for use in PCR to generate the reference curve, slope rate of the straight line (a) = -3.42089, intercept (b) = 5.97517, correlation coefficient (r) = 0.9996. The strength of Bmi1 and β-actin was directly generated by the machine.
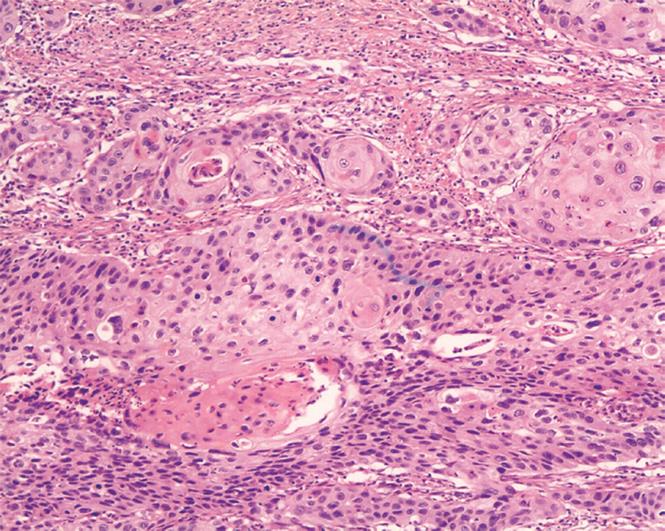
Figure 2 Staining of ESCC tissues.
The tumor cells of cancerous tissues were stained as violet in the nucleus and pink in the cytoplasm (× 100).
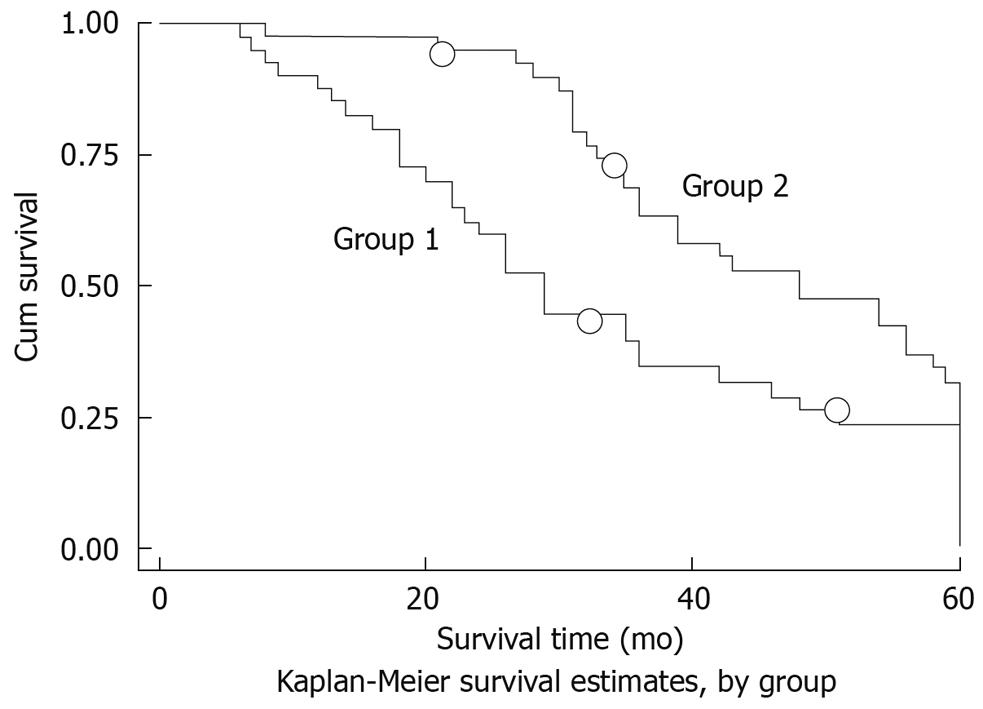
Figure 3 Effects of Bmi1 mRNA expression on prognosis of ESCC patients.
Two patients did not complete the 5-year follow-up in each group (small circles). The survival rate was higher in the down-expression group (group 2) than in the up-expression group (group 1), χ2 = 4.41, P = 0.0356.
Figure 4 Immunohistochemical staining of ESCC using antibody to Bmi-1.
A: Bmi1 protein expression in adjacent non-cancerous tissues (× 400); B: Cytoplasm staining of Bmi1 in ESCC cells (× 400); C: Intense Bmi-1 staining in the nucleus in ESCC cells (× 400). The brown staining under light microscopy indicates positivity.
- Citation: He XT, Cao XF, Ji L, Zhu B, Lv J, Wang DD, Lu PH, Cui HG. Association between Bmi1 and clinicopathological status of esophageal squamous cell carcinoma. World J Gastroenterol 2009; 15(19): 2389-2394
- URL: https://www.wjgnet.com/1007-9327/full/v15/i19/2389.htm
- DOI: https://dx.doi.org/10.3748/wjg.15.2389


