Copyright
©2009 The WJG Press and Baishideng.
World J Gastroenterol. May 21, 2009; 15(19): 2345-2350
Published online May 21, 2009. doi: 10.3748/wjg.15.2345
Published online May 21, 2009. doi: 10.3748/wjg.15.2345
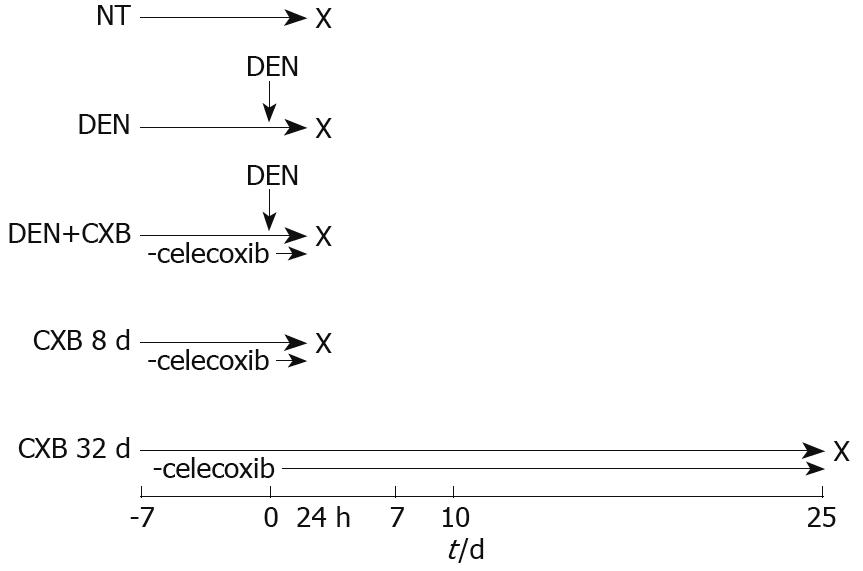
Figure 1 Schematic representation of CXB administration in the hepatocarcinogenesis model.
In the NT group, rats were maintained on a basal diet. DEN and DEN+CXB groups were treated with DEN. The CXB diet was given from 7 d before DEN administration until sacrifice, indicated with X (n = 4).
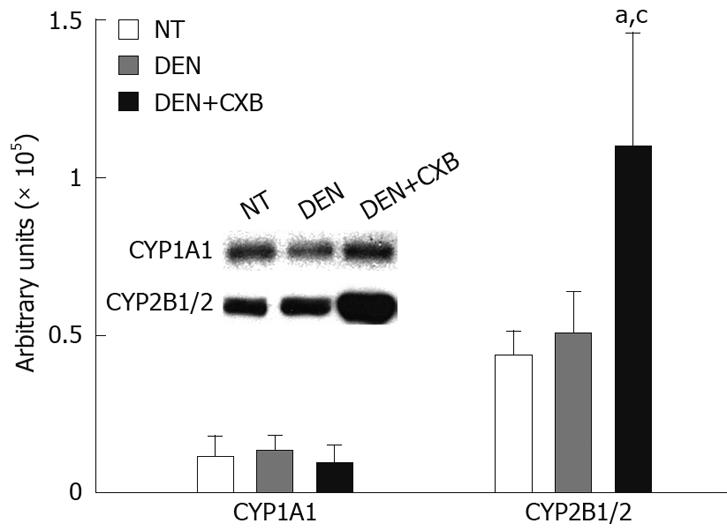
Figure 2 Immunodetection of hepatic microsomal CYP isoforms from DEN- and/or CXB-treated rats.
Microsomal proteins (15 and 30 &mgr;g/lane for CYP2B1/2 and CYP1A1, respectively) were separated by SDS-PAGE and tested for different CYPs using specific anti-rat CYP antibodies. The bands in the inset box correspond to CYP2B1/2 and CYP1A1 protein detected in the NT, DEN and DEN+CXB groups. The graphic represents the densitometric analysis of the CYP amounts in the experimental groups. aP < 0.05, vs NT group; cP < 0.05 vs DEN group, Bonferroni test. n = 4 for all groups.
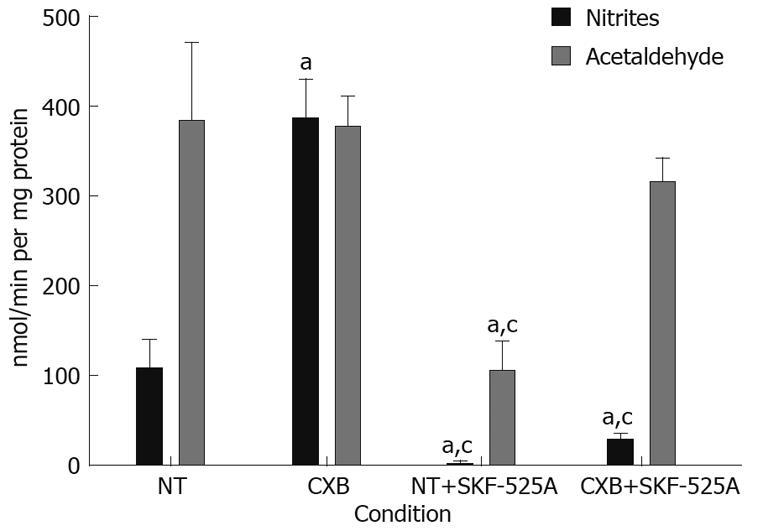
Figure 3 In vitro metabolism of DEN in non-treated and CXB-treated rat hepatic microsomes.
The denitrosation rate was measured by the production of nitrites, and the deethylation rate was measured by the production of acetaldehyde in the presence or absence of SKF-525A. Values are presented as mean ± SD. aP < 0.05, vs NT group; cP < 0.05 vs CXB group. Bonferroni test, n = 4 for all groups.
- Citation: Salcido-Neyoy ME, Sierra-Santoyo A, Beltrán-Ramírez O, Macías-Pérez JR, Villa-Treviño S. Celecoxib enhances the detoxification of diethylnitrosamine in rat liver cancer. World J Gastroenterol 2009; 15(19): 2345-2350
- URL: https://www.wjgnet.com/1007-9327/full/v15/i19/2345.htm
- DOI: https://dx.doi.org/10.3748/wjg.15.2345


