Copyright
©2009 The WJG Press and Baishideng.
World J Gastroenterol. Mar 28, 2009; 15(12): 1506-1511
Published online Mar 28, 2009. doi: 10.3748/wjg.15.1506
Published online Mar 28, 2009. doi: 10.3748/wjg.15.1506
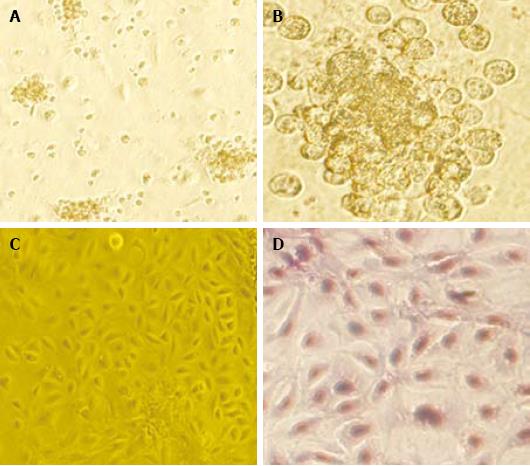
Figure 1 HE stained HOC 10 h (A, × 100), 7 (B, × 400), 10 (C, × 100), and 14 d (D, × 200) after incubation.
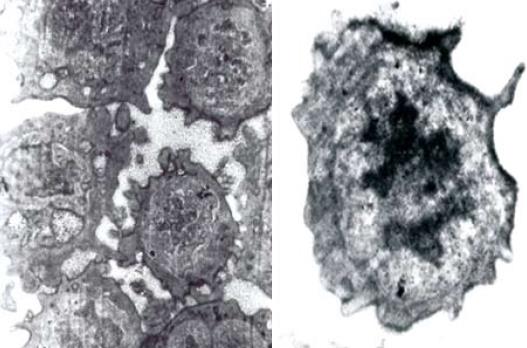
Figure 2 Ultra-structure of rat HOC under electron microscope (× 4000).
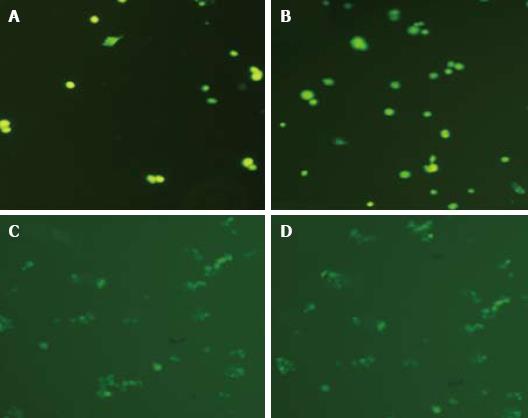
Figure 3 CFDA-SE stained HOC at 0 h (A, × 200), 6 h (B, × 200), 24 h (C, × 100), and 72 h (D, × 100).
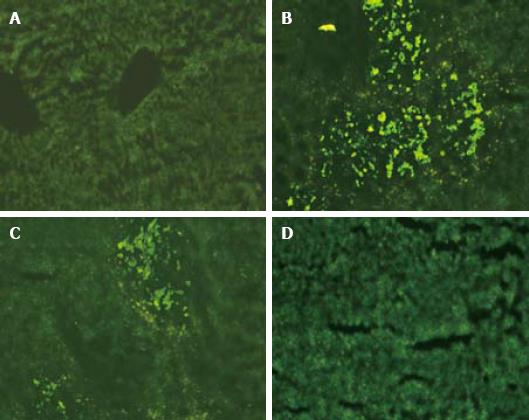
Figure 4 Fluorescent microscopy showing colonies in control group (A), and 3 (B), 7 (C) and 14 d (D) after HOC transplantation (× 100).
- Citation: Wu CX, Zou Q, Zhu ZY, Gao YT, Wang YJ. Intrahepatic transplantation of hepatic oval cells for fulminant hepatic failure in rats. World J Gastroenterol 2009; 15(12): 1506-1511
- URL: https://www.wjgnet.com/1007-9327/full/v15/i12/1506.htm
- DOI: https://dx.doi.org/10.3748/wjg.15.1506


