Copyright
©2009 The WJG Press and Baishideng.
World J Gastroenterol. Mar 21, 2009; 15(11): 1373-1380
Published online Mar 21, 2009. doi: 10.3748/wjg.15.1373
Published online Mar 21, 2009. doi: 10.3748/wjg.15.1373
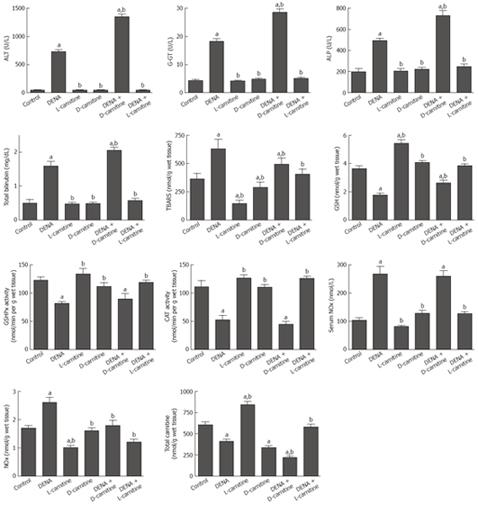
Figure 1 Effect of DENA on serum liver function indices, oxidative stress biomarkers, activities of antioxidant enzymes, NOx concentration and total carnitine levels in liver tissues from carnitine supplemented and depleted rats.
Data are presented as mean ± SE (n = 10). aP < 0.05 vs control; bP < 0.05 vs DENA, at P < 0.05 using ANOVA followed by Tukey-Kramer as a post ANOVA test.
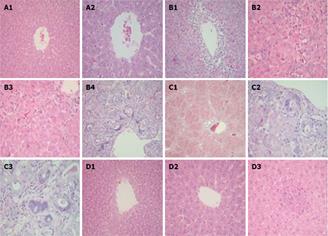
Figure 2 Photomicrographs of liver specimens stained with H&E.
A: Liver from control rat showing normal liver histology with unremarkable central vein (A1, × 20 and A2, × 40); B: Liver from rat treated with DENA showing central vein surrounded by extensive necrosis and inflammatory infiltrate (B1, × 20), considerable hepatocyte necrosis represented with arrows (B2 and B3, × 40) and portal tract with bile duct proliferation and marked atypia (B4, × 20); C: Liver from rat treated with DENA plus D-carnitine-mildronate showing diffuse bridging fibrosis and nodule formation (C1, × 10) and bile ducts with marked reactive atypia showing nuclear enlargement, high nuclear/cytoplasmic ratio and prominent nucleoli (C2 and C3, × 40); D: Liver from rat treated with DENA and L-carnitine showing normal liver (D1, × 20) with unremarkable central vein (D2, × 40) and hepatic lobule with a focus of inflammatory infiltrate but no necrosis (D3, × 40).
- Citation: Al-Rejaie SS, Aleisa AM, Al-Yahya AA, Bakheet SA, Alsheikh A, Fatani AG, Al-Shabanah OA, Sayed-Ahmed MM. Progression of diethylnitrosamine-induced hepatic carcinogenesis in carnitine-depleted rats. World J Gastroenterol 2009; 15(11): 1373-1380
- URL: https://www.wjgnet.com/1007-9327/full/v15/i11/1373.htm
- DOI: https://dx.doi.org/10.3748/wjg.15.1373


