Copyright
©2009 The WJG Press and Baishideng.
World J Gastroenterol. Mar 21, 2009; 15(11): 1331-1338
Published online Mar 21, 2009. doi: 10.3748/wjg.15.1331
Published online Mar 21, 2009. doi: 10.3748/wjg.15.1331
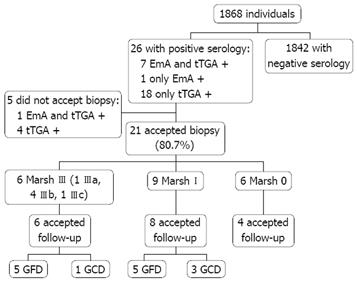
Figure 1 Flow diagram of recruited subjects.
GCD: Gluten-containing diet.
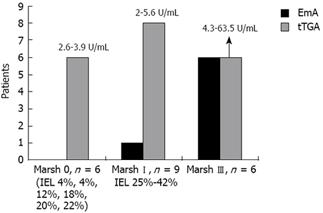
Figure 2 Values of tTGA related to the degree of histological damage.
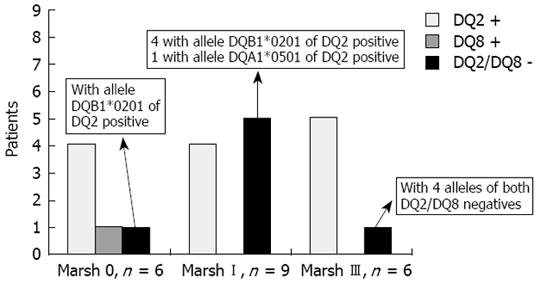
Figure 3 HLA DQ2/8 related to the degree of histological damage.
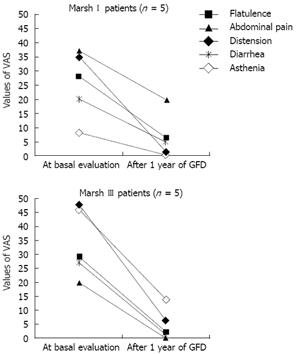
Figure 4 Evolution of the mean values of the VAS after GFD.
- Citation: Mariné M, Fernández-Bañares F, Alsina M, Farré C, Cortijo M, Santaolalla R, Salas A, Tomàs M, Abugattas E, Loras C, Ordás I, Viver JM, Esteve M. Impact of mass screening for gluten-sensitive enteropathy in working population. World J Gastroenterol 2009; 15(11): 1331-1338
- URL: https://www.wjgnet.com/1007-9327/full/v15/i11/1331.htm
- DOI: https://dx.doi.org/10.3748/wjg.15.1331


