Copyright
©2008 The WJG Press and Baishideng.
World J Gastroenterol. Mar 7, 2008; 14(9): 1333-1338
Published online Mar 7, 2008. doi: 10.3748/wjg.14.1333
Published online Mar 7, 2008. doi: 10.3748/wjg.14.1333
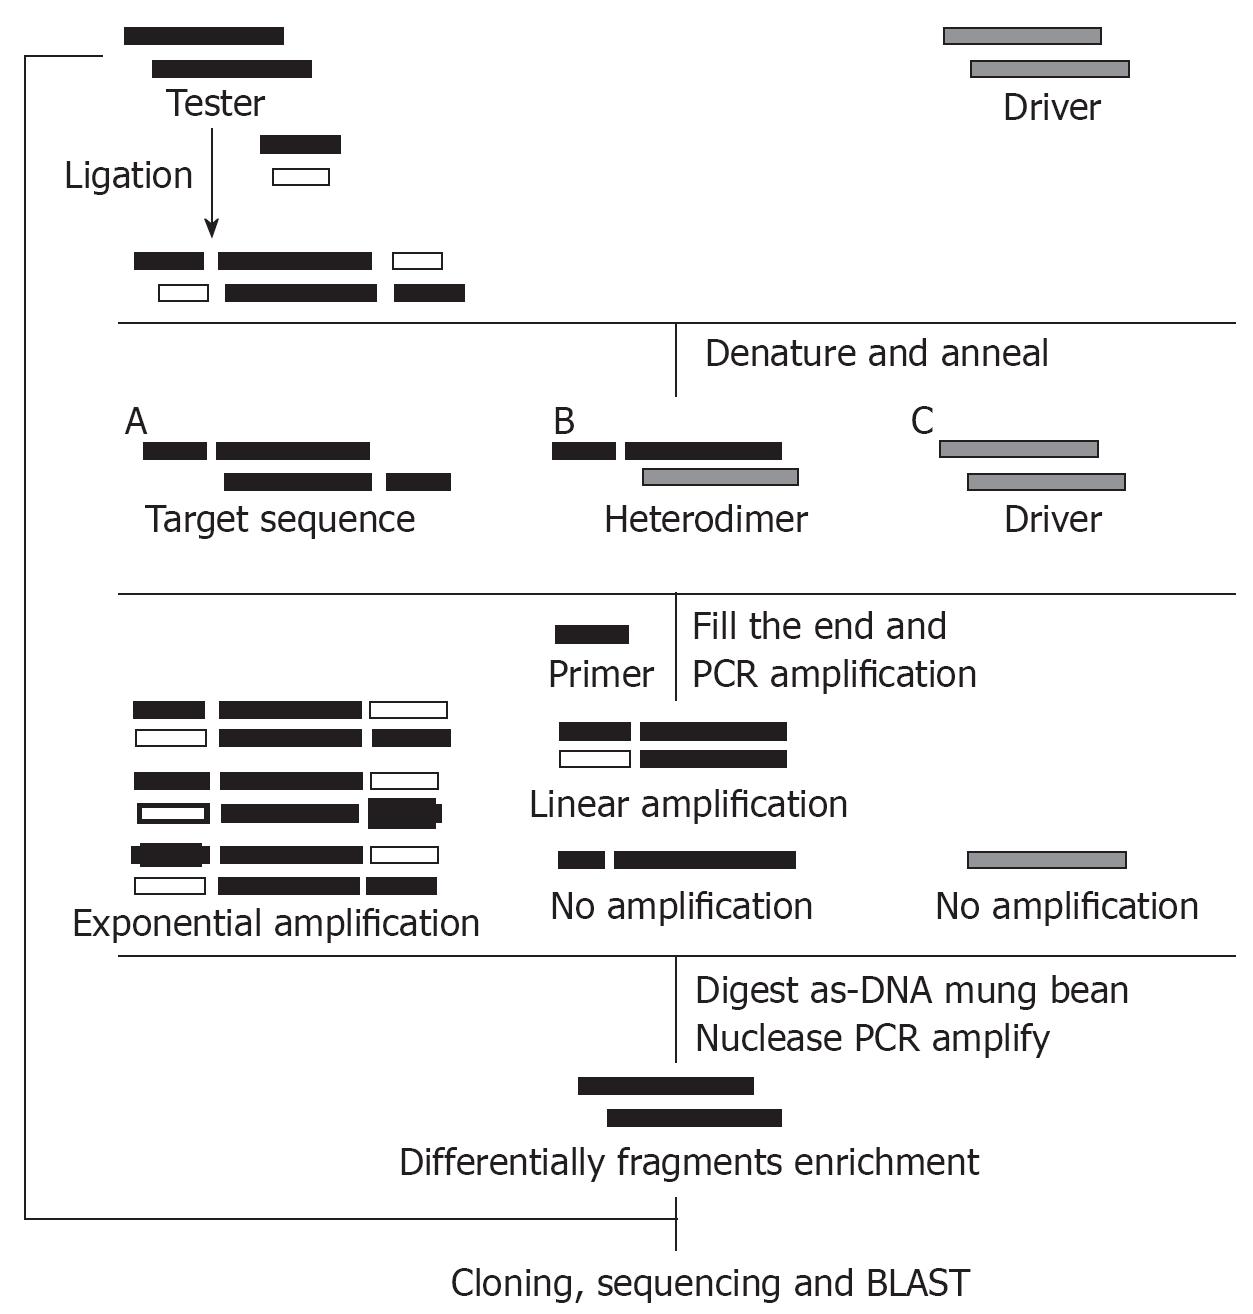
Figure 1 Schematic diagram of MS-RDA experimental strategy.
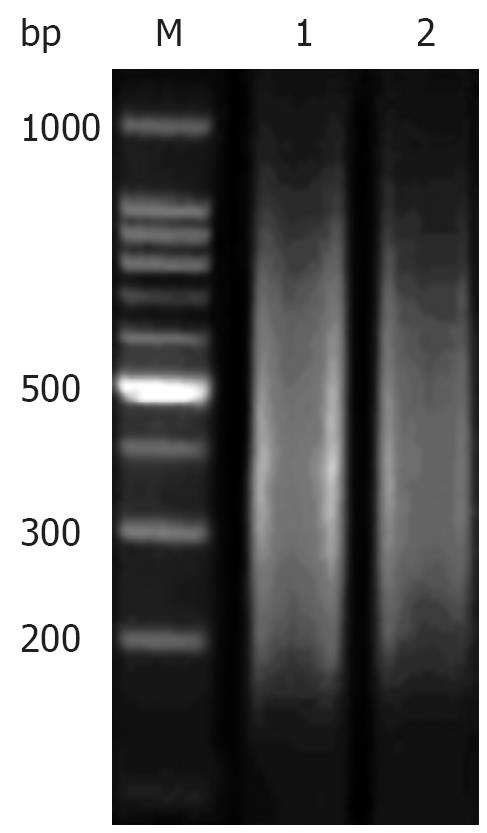
Figure 2 Amplicons of gastric cancer and normal gastric mucosa.
M: DNA marker; 1: Gastric cancer amplicon; 2: Normal gastric mucosa amplicon.
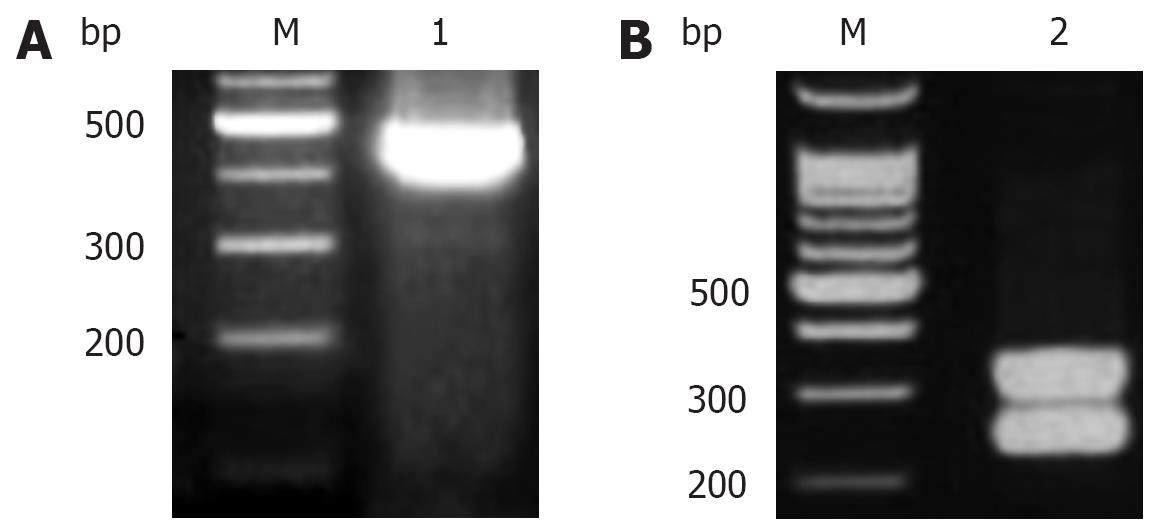
Figure 3 A: Results after the third cycle of competitive hybridization.
B: After a second cycle of competitive hybridization. M: DNA marker; 1: differentially methylated fragment of approximately 400 bp; 2: Two differentially methylated fragments, one is approximately 400 bp and the other lies between 200-300 bp.
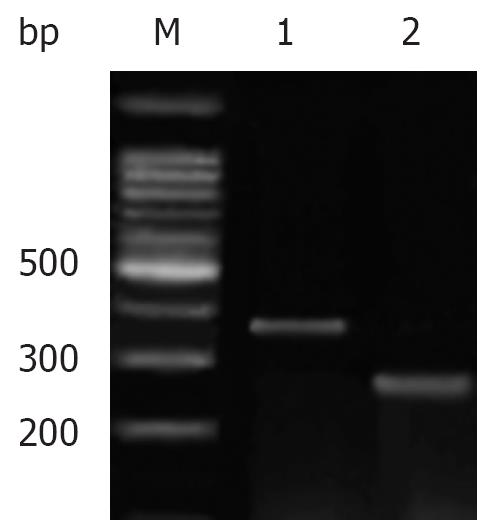
Figure 4 PCR results.
M: DNA marker; 1: Differ-entially methylated fragment of approximately 400 bp; 2: Differentially methylated fragment of approximately 200-300 bp.
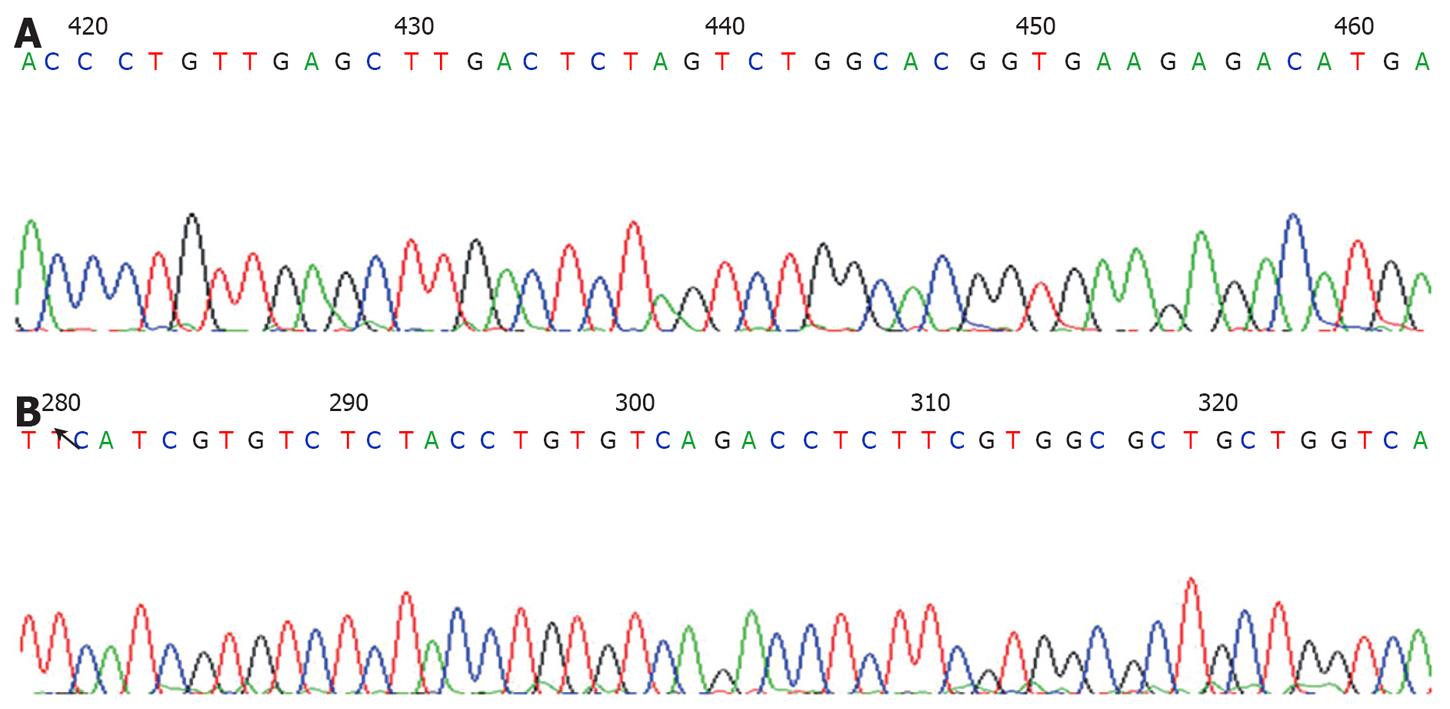
Figure 5 AY887106 (A) and AY887107 (B) sequencing.
- Citation: Liao AJ, Su Q, Wang X, Zeng B, Shi W. Isolation and bioinformatics analysis of differentially methylated genomic fragments in human gastric cancer. World J Gastroenterol 2008; 14(9): 1333-1338
- URL: https://www.wjgnet.com/1007-9327/full/v14/i9/1333.htm
- DOI: https://dx.doi.org/10.3748/wjg.14.1333


